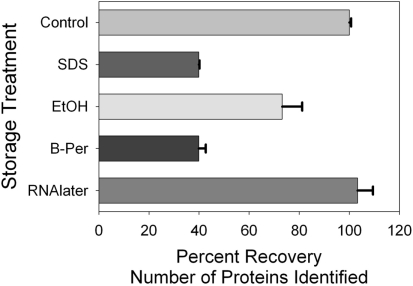
Figure 3.
Comparison of number of protein identifications acquired from the control and four preservation techniques. Each sample was analyzed twice by LC–MS and the values reflect the average and SD, normalized to the control treatment (504 ± 4 protein identifications in each technical replicate of the control sample, the control = 100%).

