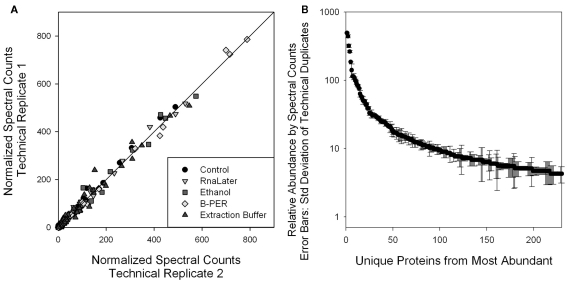
Figure 4.
(A) Comparison of technical replicate injections of each of the four preservative samples and the control. Precision of the more abundant proteins using this 1-D LC/MS spectral counting relative quantitation approach was evident in the coherence with the 1:1 line. This reproducibility of protein spectral counts scores enabled the comparison of relative abundances of individual proteins with different preservation techniques used in Figure 5. (B) Average and SD of the technical duplicate normalized spectral counts from the control sample. Relative SD is 26% or less for the 100 highest abundance proteins, as determined by spectral counts. This error is smaller than the several fold variation observed in degradation studies shown in Figure 5.

