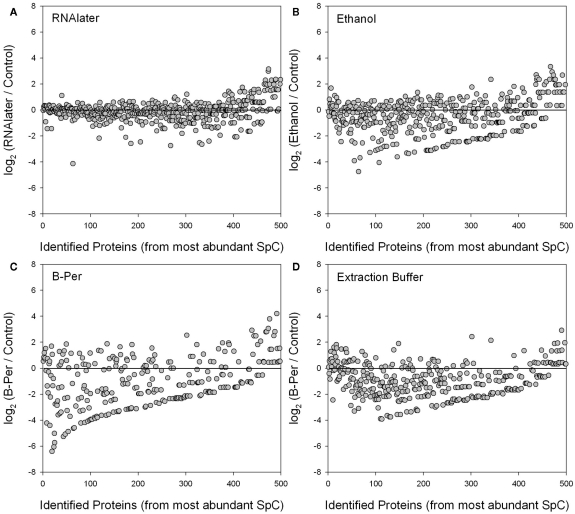
Figure 5.
Log2 ratios of individual protein relative abundances (average of technical duplicates) identified in each of four preservatives (RNAlater, ethanol, B-PER, and SDS-extraction buffer) relative to the control treatment (average of technical duplicates). The proteins are ordered on the horizontal axis from those with the highest number of normalized spectral counts (SpC). Log2 ratios close to zero (horizontal lines) reflect similar normalized spectral count scores for each protein between that preservative and the control, while deviation below the line indicates lower abundance in the preserved sample than the control due to degradation. Normalization and weighting of spectral counts results involves normalizing to the total number of spectra within each sample, and weighting across samples (including replicates). The RNAlater treatment (A) showed the least degradation relative to the control, and perhaps even shows a higher relative abundance of rarer proteins in the RNAlater sample (far right). Ethanol (B) and SDS-extraction buffer (D) showed good recovery of the most abundant proteins, but degradation of many of the less abundant ones. The B-PER treatment (C) showed degradation throughout including the most abundant proteins. The upward-sloping line of data points in the bottom of (B–D) were caused by a combination of the abundance ordering on the horizontal axes and the low spectral counts of degraded proteins in the preserved treatment.

