Fig. 3.

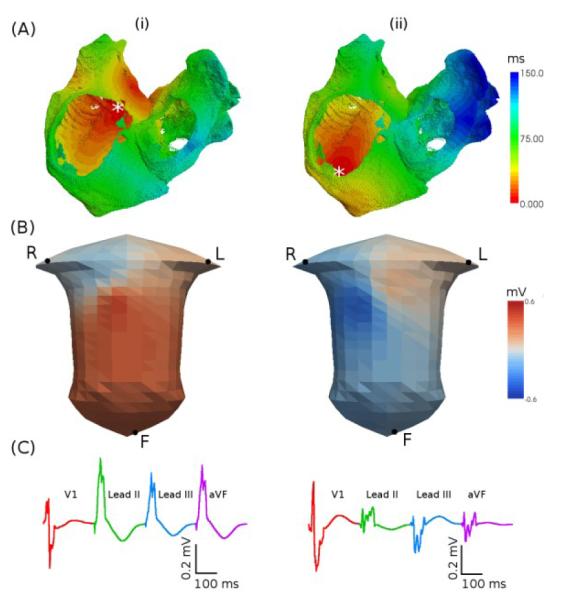
Activation patterns simulated with the human atrial and torso model. A: Activation times. B: BSP snapshots. C: P-waves. Two focal locations (indicated by an asterisk) are considered: superior (i) and inferior (ii) CT.

Activation patterns simulated with the human atrial and torso model. A: Activation times. B: BSP snapshots. C: P-waves. Two focal locations (indicated by an asterisk) are considered: superior (i) and inferior (ii) CT.