
Figure 1.
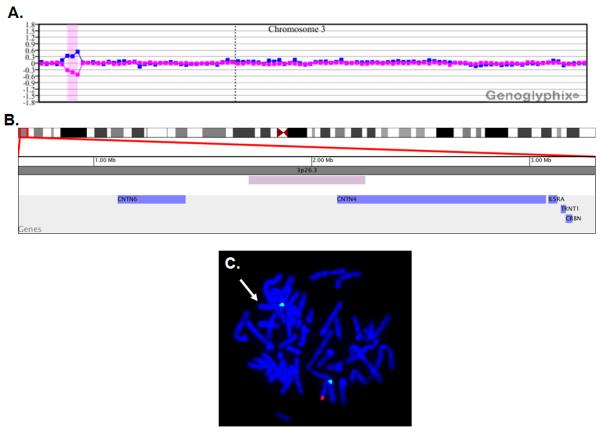
Microarray and FISH characterization of 3p26.3 deletion in patient A154. (A) Microarray analysis using a bacterial artificial chromosome (BAC)-based microarray (SignatureChip v4.0, Signature Genomic Laboratories, Spokane, WA) was performed using previously published methods [Bejjani et al., 2005] and showed a single-copy loss of 3 BAC clones from the short arm of chromosome 3 at 3p26.3 (chr3:1,711,180-2,245,625, UCSC March 2006 hg18 assembly), approximately 535 kb in size. Probes are arranged with the most distal p-arm clones on the left and the most distal q-arm clones on the right. The blue line is a plot of the array CGH data from the first microarray experiment (reference Cy5/patient Cy3). The pink line is a plot of the array CGH data from the second microarray experiment in which the dyes have been reversed (patient Cy5/reference Cy3). (B) A zoomed-in image of the deletion shown in (A). The minimal deletion size is represented by the purple bar, and the blue bars represent genes. Results are visualized using Genoglyphix (Signature Genomic Laboratories, Spokane, WA). (C) Metaphase FISH analysis showing deletion of the region shown by microarray analysis in (A). BAC clone RP11-96G4 from 3p26.3 is labeled in red, and the chromosome 3 centromere probe is labeled in green as a control. Missing red signal and retained green signal indicates deletion at 3p26.3 on one homologue (arrow).