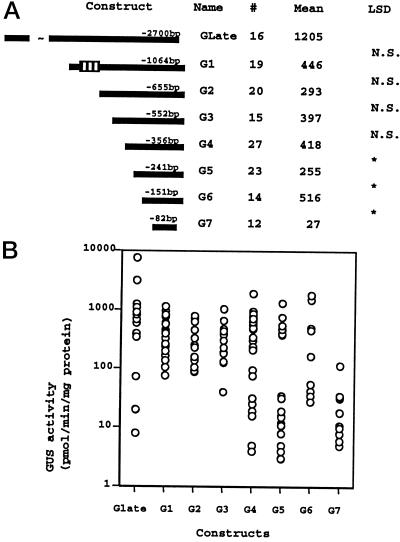
Figure 6.
Diagram of the NADH-GOGAT promoter-GUS gene constructs. A, Eight sequences containing the putative NADH-GOGAT promoter were translational fusions to the GUS gene; the length of these truncations is measured with respect to the transcriptional start. The boxed region in construct G1 marks the location of the 88-bp direct repeat. The number of individual transformants tested for each construct is indicated (#). Mean GUS activity (pmol min−1 mg−1 protein) is indicated with the heading “Mean.” lsd values between adjacent deletions were calculated, and the level of significance was set at P < 0.01. N.S., Not significant; *, significant at P < 0.01. B, Distribution of GUS activity per construct measured from individual independently transformed plants.

