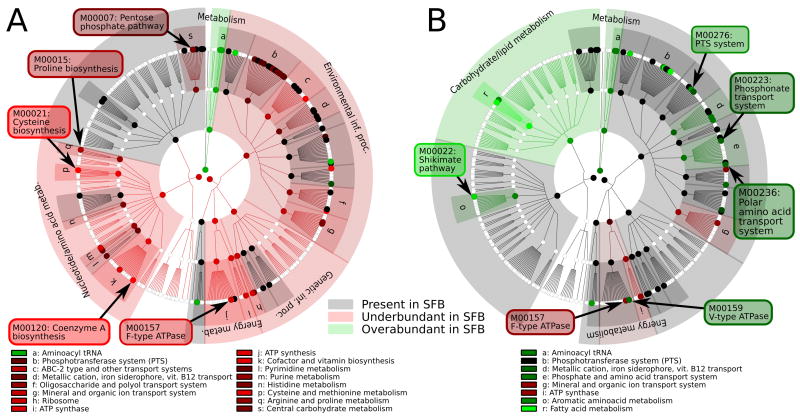
Figure 3. KEGG modules over- and under-represented in the SFB genome compared to its 20 most similar organisms.
Overview of the KEGG functional hierarchy; highlighted leaf nodes represent metabolic modules over- (green) or under-enriched (red) in SFB relative to the 20 most functionally similar organisms. Black circles represent modules present at a similar level in SFB and these organisms (absolute z-score <1) and white circles are absent in both. Similar organisms were computed using A) Tversky index α = 0.75 (representing larger related genomes) and B) Tversky index α = 0.25 (smaller, more minimal related organisms) and are listed in Table 2. A complete list of KEGG modules differentiating SFB from functionally similar organisms can be found in Table S4A and S4B.

