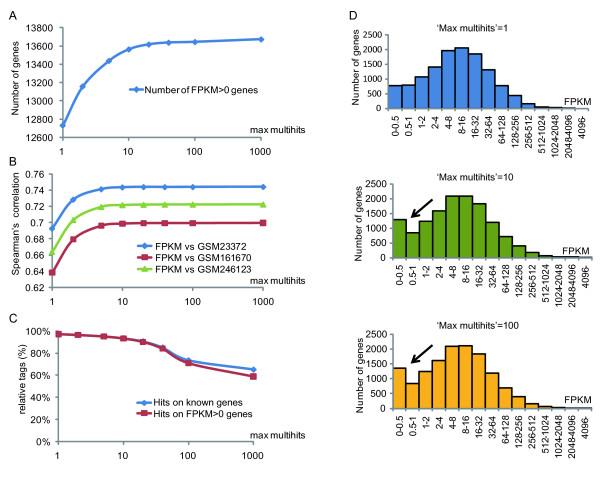
Figure 1.
Plots to assess the effect of the parameter 'Max multihits' (X-axis). 'Max multihits' is a TopHat parameter that indicates how many times one tag is permitted to be aligned. (a) Number of genes found by RNAseq (Y-axis) against 'Max multihits'. (b) Spearman's correlation between microarrays (GSM23372, GSM161670, and GSM246123) and RNAseq. (c) Y-axis indicates how many splicing sites found in TopHat were included in known genes or FPKM > 0 genes. (d) Histogram showing the distribution of FPKM. As the number of permitted 'Max multihits' increased, the quantity of genes with small FPKM values increased (black arrows).

