
Figure 1.
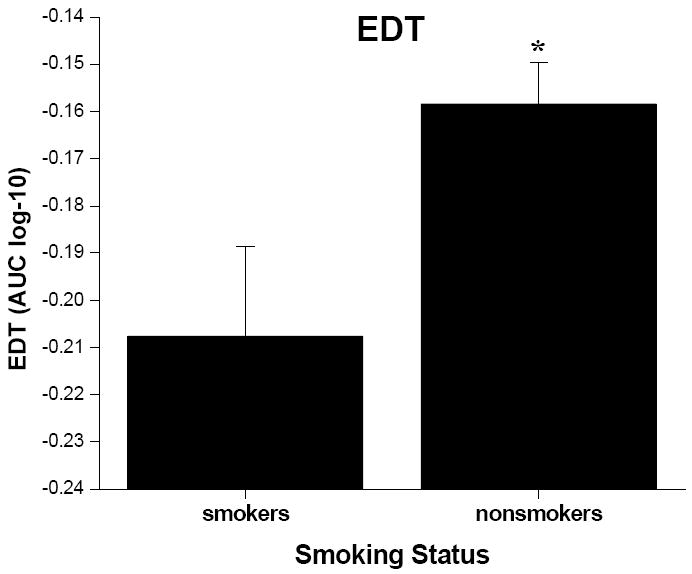
Mean (+ SEM, denoted by the error bars) AUC values from the EDT for smokers and nonsmokers.* indicates significant difference from smokers at p < .05 level.
Official websites use .gov
A
.gov website belongs to an official
government organization in the United States.
Secure .gov websites use HTTPS
A lock (
) or https:// means you've safely
connected to the .gov website. Share sensitive
information only on official, secure websites.
Mean (+ SEM, denoted by the error bars) AUC values from the EDT for smokers and nonsmokers.* indicates significant difference from smokers at p < .05 level.