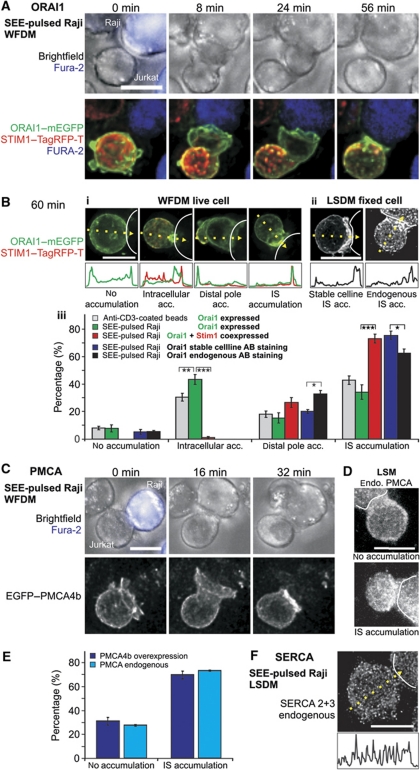
Figure 1.
STIM1, ORAI1 and PMCA4b localization at the IS. (A) Widefield deconvolution microscopy (WFDM) of an ORAI1–mEGFP (green) and STIM1–TagRFP-T (red) overexpressing Jurkat T cell contacting a SEE-pulsed Raji B cell, which was stained with fura-2/AM (blue) (see also Supplementary Movie S2). Displayed as XY maximum intensity projections (MIP), STIM1 co-accumulates with ORAI1 first in a cap-like structure distal to the contact point (IS) before being translocated together with ORAI1 to the IS. (B) Example of ORAI1 accumulation 60 min after contact with SEE-pulsed Raji cells (dotted lines). (i) Shown are four Jurkat T cells overexpressing ORAI1–mEGFP (green) and STIM1–TagRFP-T (red, the red channel overlaps with ORAI1 and is mostly visible as yellow, the cell with ‘no accumulation’ did not express STIM1). The line graphs depict fluorescence distribution in the yellow arrows. (ii) Examples of either ORAI1 stable expressing cells or endogenous antibody stained cells accumulating ORAI1 at the IS. (iii) Statistical analysis of ORAI1 accumulation phenotypes 60 min after contact with a SEE-pulsed Raji cell or an anti-CD3 antibody-coated bead (beads: N=13 experiments, n=234 cells; Raji: N=9, n=203; ORAI1+STIM1 Raji: N=6, n=109; stable: N=4, n=161; endogenous: N=3, n=91, stable/endogenous ORAI1 P (distal)=0.029, P (IS)=0.03). (C) Contact between an EGFP–PMCA4b expressing Jurkat T cell and a SEE-pulsed Raji B-cell (blue). PMCA4b is enriched at the IS after contact (see in the picture taken 32 min after contact). (D) Phenotype examples of fixed cells stained for endogenous PMCA. (E) Statistical analysis of living and fixed cells like the ones shown in (D, E) (live: N=11, n=76; fixed: N=3, n=91). (F) Example of a cell fixed and stained with an antibody against SERCA 2 and 3. Scale bars are 10 μm.

