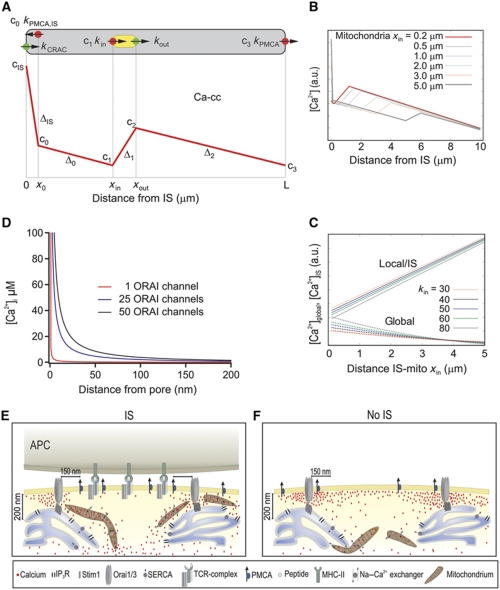
Figure 9.
Mathematical model for the spatial arrangement of CRAC channels, mitochondria and PMCAs and the dependence of Ca2+ concentrations on the distance between IS and mitochondria (A) Overview over the one-dimensional model: cytosol is grey, mitochondria are yellow, Ca2+ sources are green and Ca2+ sinks are red. The red curve represents the expected spatial profile of the cytosolic Ca2+ concentration. cIS is the concentration at the location of the CRAC channel (x=0), c0 ca. 100 nm away from the CRAC channel (at x0), c1 at the front end of the mitochondria (x=xin), c2 at the back end (x=xout) and c3 at the PMCA pumps away from the IS (x=L). The slopes of the linear parts are denoted as ΔIS, Δ0, Δ1 and Δ2 (see Supplementary data). (B) Stationary Ca2+ concentration cs(x) as a function of x for different positions xin of the mitochondria. The parameters are kCRAC=200/s, kin=60 μm/s, kPMCA=20 μm/s, kPMCAI,S=40 μm/s. Note that parameters and concentrations are given in one-dimensional units, the three-dimensional equivalent can be computed with formula 10 in the Supplementary data. (C) Comparison of the stationary local Ca2+ concentration at the IS, cIS (upper curves) and the average global Ca2+ concentrations cglobal (lower curves) as a function of the distance xin between IS and mitochondria for mitochondrial input rates kin. The parameters are kCRAC=200/s, kin=30–80 μm/s, kPMCA=20 μm/s, kPMCAI,S=40 μm/s. Note that parameters and concentrations are given in one-dimensional units, the three-dimensional equivalent can be computed with formula 10 in the Supplementary data. (D) Mathematical estimation of a Ca2+ microdomain near an open ORAI channel (red curve), and around 25 (blue curve) and 50 (black curve) ORAI channels. Single channel current was assumed to be 3.8 fA (Prakriya and Lewis, 2002, 2006; Prakriya et al, 2006). EGTA concentration was 1.2 mM, thus, the mean path length (λ) value was ∼400 nm. For channel clusters (∼60–100 nm wide; Park et al, 2009), which are small relative to λ, the clusters can be approximated by a single channel with the sum of all individual channels (Naraghi and Neher, 1997; Neher, 1998). Note that physiological activation of ORAI channels only occurs through the formation of channel clusters directly beneath STIM1 puncta. (E, F) Cartoons illustrate the physiological (IS) and non-physiological (No IS) activation of T cells. Following IS formation, mitochondria are quickly transported by the actin cytoskeleton (not shown for simplicity) to the IS in the immediate vicinity of ORAI channel clusters (∼200 nm away). This translocation allows them to prevent the slow Ca2+-dependent ORAI channel inactivation by reducing the magnitude and/or extension of Ca2+ microdomains and thereby sustaining the activity of ORAI channels. In addition, PMCA re-distribute into areas of the PM where mitochondria are present, which induces a significant reduction of local Ca2+ microdomain-dependent modulation of PMCA activity. The subcellular organelle distribution induces higher [Ca2+]i, which is translated into more sustained NFAT activity, more efficient T-cell activation and increased cell proliferation. In the absence of IS formation (i.e. TG stimulation), mitochondria do not approach subplasmalemmal areas (<200 nm) and PMCA are not re-distributed in the PM. Therefore, Ca2+ microdomains and subsequent subplasmalemmal Ca2+ signals are higher, which in turn induce the slow Ca2+-dependent ORAI channel inactivation.

