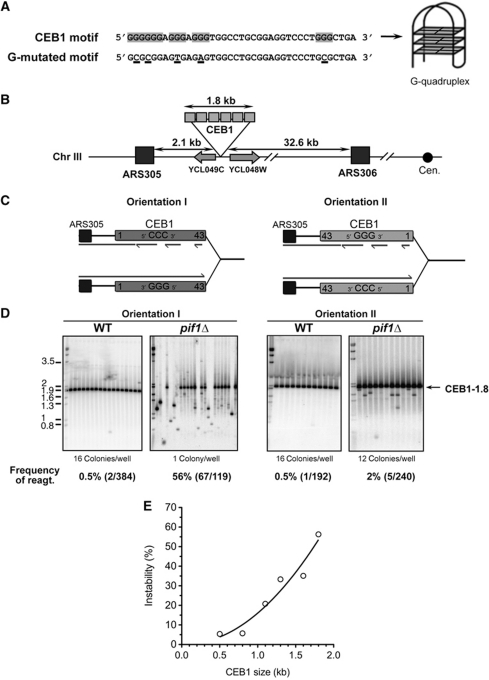
Figure 1.
Orientation-dependent destabilization of CEB1 inserted near ARS305 in pif1Δ cells. (A) Nucleotide sequence of CEB1 motifs shown in the 5′–3′ orientation. CEB1 motif: more common motif in the natural CEB1-1.8 minisatellite (Lopes et al, 2006a). The G-tracts involved in the G-quadruplex formation (Ribeyre et al, 2009) are highlighted. G-mutated CEB1 motif: sequence of the synthetic CEB1 G-mutated motif assembled in the artificial CEB1-Gmut-1.7 tandem array (Ribeyre et al, 2009). The mutated nucleotides are underlined. (B) Map of the chromosome III region in which the CEB1 arrays were inserted (see Supplementary Methods). (C) Mode of replication of CEB1 by forks emanating from ARS305 upon insertion in orientation I (left) or II (right). In orientation I, the G-quadruplex-forming strand is the template of leading-strand replication. In orientation II, the G-quadruplex-forming strand is the template of lagging-strand replication. (D) Behaviour of CEB1-1.8 in orientations I (left) and II (right) in WT (ORT6119-4 and ORT6135-36, respectively) and in pif1Δ (ORT6146-1 and ORT6136-8, respectively) cells visualized by Southern blot analysis. The number of colonies analysed per lane is indicated. The molecular ladder (in kb) allows for the size determination of the DNA fragments at a resolution of ±1 motif (40 bp). Genomic DNAs were digested with ApaI/XhoI (orientation I for WT and pif1Δ cells), ApaI/NcoI (orientation II for WT cells), and ApaI/SacII (orientation II for pif1Δ cells). Membranes were hybridized with radiolabelled CEB1 probe. The total rearrangement frequencies (%), and in parenthesis the absolute number of rearrangements over the total number of colonies analysed, are reported below the blots. Statistical analyses (P-values) of rearrangement frequencies between strains are reported in Table I. (E) Size effect of CEB1 in orientation I on its rearrangement frequency in pif1Δ cells. A non-linear, second order fit has been applied (R2=0.9133). Strain names and numerical data are reported in Supplementary Tables S1 and S2, respectively.

