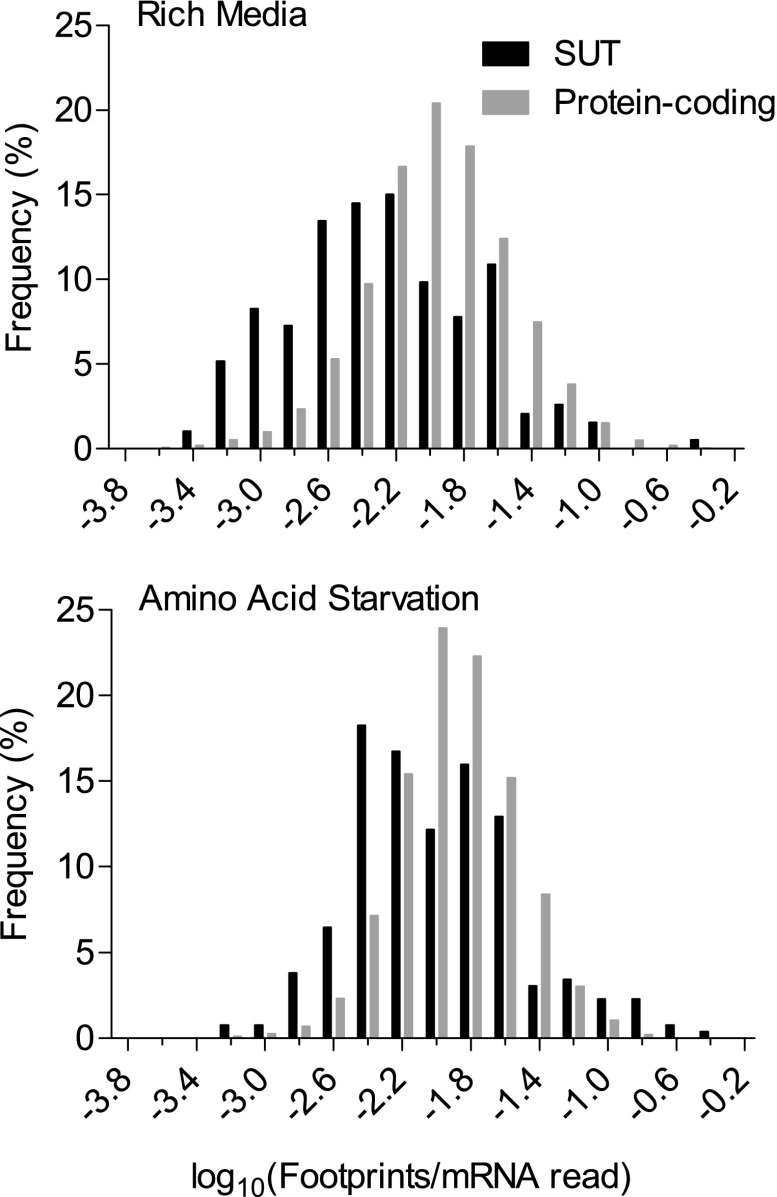
FIG. 1.–
Histogram of ribosomal densities for transcripts annotated as protein coding and for other ribosomally associated transcripts (SUTs). Although ribosomal densities are lower for SUTs, there is substantial overlap, with many SUTs associated with ribosomes at levels typical for protein-coding transcripts. SUT–ribosome associations increase under starved conditions, whereas associations with protein-coding transcripts do not. Ribosomal density is calculated as the number of ribosome footprint mappings for a given transcript normalized by the number of mRNA mappings for the same transcript in the same experimental replicate. We pooled the two replicates available for each of the two (rich vs. starved) conditions. Transcripts showing no ribosomal association were excluded: numbers for these are given in the text.

