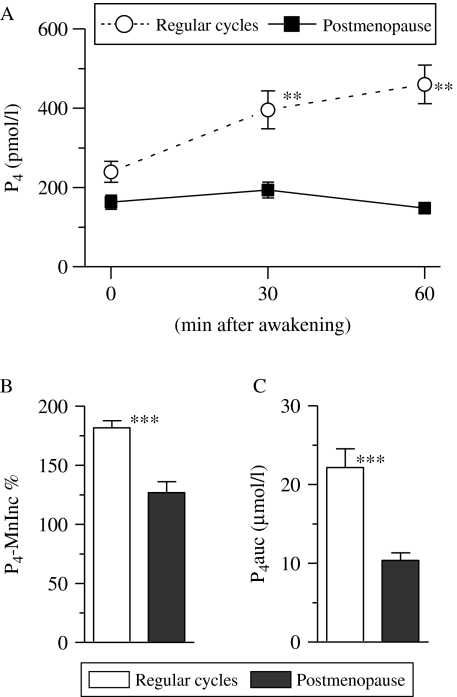
Figure 3.
Difference in progesterone (P4) concentration within the first hour after awakening in women with regular menstrual cycles and postmenopausal women. P4 concentration at each examined time point is depicted in (A). The relative mean increase in P4 concentration 30 and 60 min after awakening over the individual baseline (P4-MnInc %) and integrated P4 concentration ranging from the time immediately upon awakening to 60 min after awakening (i.e. area under the P4 curve with respect to baseline, P4auc) are depicted in (A and B) respectively. Each data point in (A) and each bar in (B and C) represents mean±s.e.m. Asterisks denote the level of significance between both groups: **P<0·01; ***P<0·001 (by the Mann–Whitney test).

