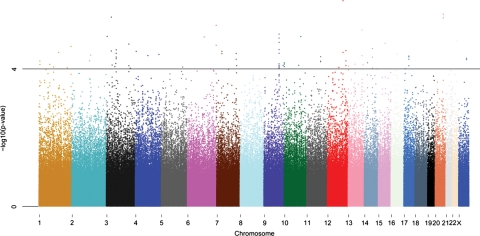
Figure 1.
Manhattan plot of the GWAS performed in the GENDER study. P-values were obtained by the Cochrane–Armitage trend test for 556 099 SNPs and 866 individuals (295 cases and 571 controls) are plotted in –log10 scale according to their chromosomal position. A horizontal black line indicates an additive P-value of 10−4.

