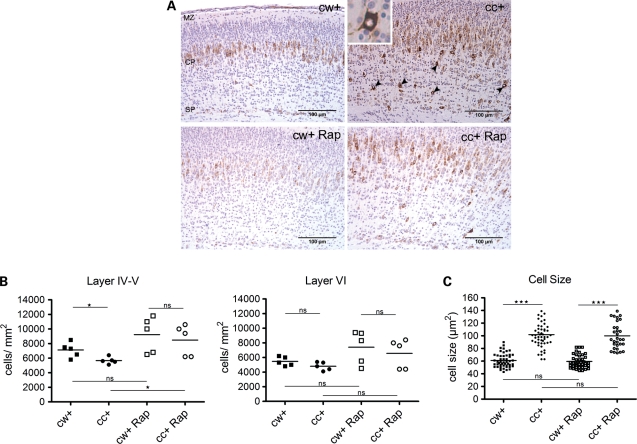
Figure 4.
Histology, cell density and size in P0 Tsc1cc Nes-cre+ mice at birth, with or without prenatal rapamycin treatment. (A) IHC with phospho-S6(Ser235) antibody in primary motor cortex of P0 mutant (cc+) and control (cw+) mice with/without prenatal rapamycin treatment at E16. Scale = 100 μm. Marginal zone, MZ; cortical plate, CP; subplate, SP. Neural cells showing hyperactivation of mTOR with heavy pS6 staining were seen in the deeper cortical plate of untreated mutant brain (arrowheads and inset). (B) Cell density measurement in layers IV–V (left) and layer VI (right) at P0. (C) Cell size measurement in layer V neurons in motor cortex at P0 indicates marked cell enlargement (n > 30 cells, three mice). *P < 0.05, **P < 0.01 and ***P< 0.001.

