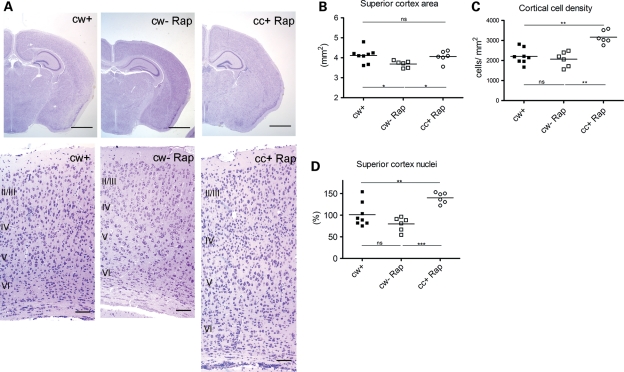
Figure 6.
Brain histology of Tsc1cc Nes-cre+ mice with pre- and postnatal rapamycin treatment. (A) Brain histology at P21. Scale = 1 mm (top), 50 mm (bottom). Note the expansion of cell cortex and increased numbers of neural cells in the cc+ Rap mouse section. (B–D) Superior cortex area (B), cortical cell density (C) and estimated total brain cells (D) in P21 mutant and control mice with pre- and postnatal rapamycin treatment. *P < 0.05, **P < 0.01 and ***P< 0.001.

