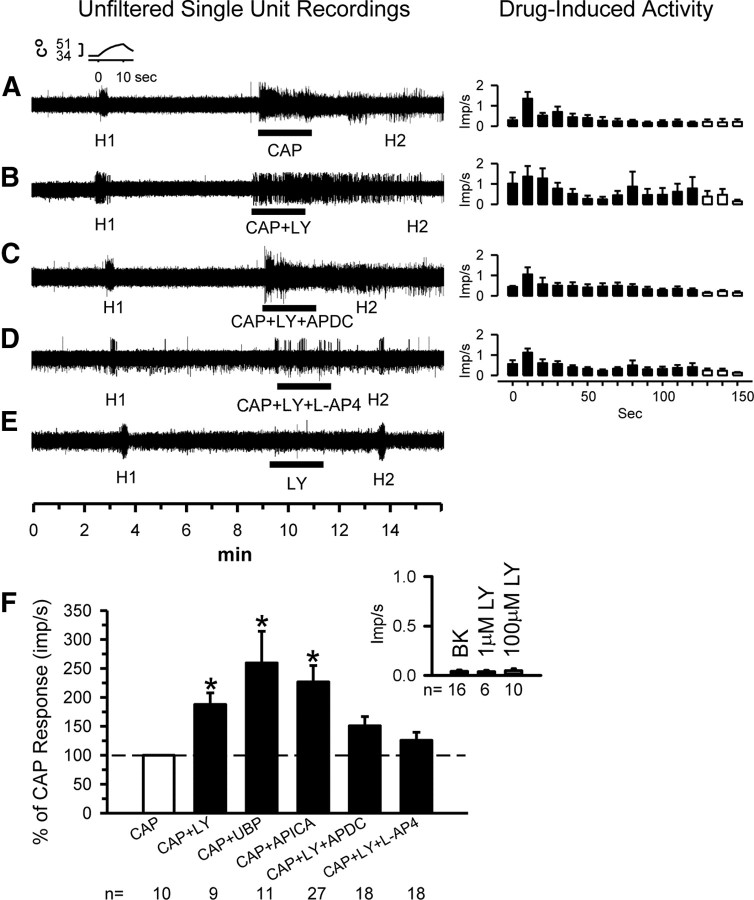
Figure 2.
Single-unit analyses confirm group II/III mGluR activity-dependent inhibition of nociceptors. Unfiltered traces from representative nociceptive units. Each trace represents activity of a different unit. The standard paradigm includes testing the heat response (H1) of the unit (the standard heat ramp is shown in the inset), followed by a 5 min wait. Then the drug(s) of interest is place in the receptive field for 2 min, followed by a second heat test (H2). The responses (mean ± SD) of the units during the 2 min drug application are shown in the right column. Application of 0.05% CAP resulted in a robust activity (A). When CAP was applied in the presence of 100 μm LY, the activity was greatly increased in magnitude and duration, suggesting release from the autoinhibition (B). If the group II agonist 0.1 μm APDC (C) or group III agonist 10 μm l-AP-4 (D) was applied, the LY effects were reduced. LY at 100 μm had no effect on its own (E). Population responses of nociceptors recorded after exposure to LY alone, CAP alone, CAP + LY, CAP + APICA (100 μm), CAP + UBP (30 μm), CAP + LY + APDC, or CAP + LY + l-AP-4 (F). Dashed line represents the CAP response normalized to 100%. LY alone (1 or 100 μm) did not excite nociceptors above background (BK, inset) (*p < 0.05, significantly different from CAP alone, Kruskal–Wallis one-way ANOVA on ranks followed by Tukey's test).

