
Figure 3.
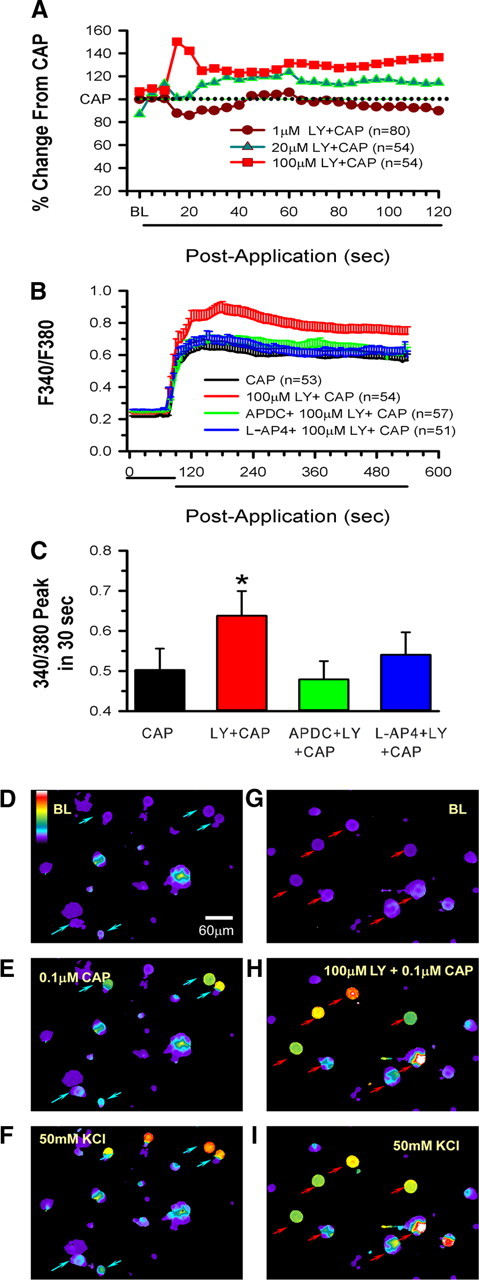
Group II/III mGluR activity-dependent inhibitory mechanisms function in acutely dissociated DRG cells. A, Dose-dependent enhancement by LY of CAP-induced Ca2+ mobilization. LY + CAP responses are normalized to the CAP alone response, which is represented by the dotted line. B, Application of 0.1 μm CAP to acutely dissociated DRG cells increases cytosolic Ca2+ that is further enhanced by 100 μm LY. If 0.1 μm APDC or 10 μm l-AP-4 is added to the CAP + LY, the LY effect is eliminated (n indicates number of cells responding). C, Peak changes in fluorescence occurring within 30 s after addition of the agents to the wells. For ease of presentation, means are plotted in C, but medians and 25th and 75th percentiles, respectively, are as follows: CAP, 0.030, 0.22, 0.77; LY + CAP, 0.49, 0.30, 0.86; APDC + LY + CAP, 0.30, 0.24, 0.67; l-AP-4 + LY + CAP, 0.34, 0.28, 0.65 (*p = 0.015, significantly different from CAP alone; the other groups are not different from CAP alone, Kruskal–Wallis one-way ANOVA on ranks followed by Dunn's test). D–I, Series of panels showing representative responses of individual DRG cells after various drug treatments (D–F are the same wells; G–I are the same wells). D and G represent baseline conditions. Addition of 0.1 μm CAP results in activation of some cells (blue arrows in E), but a more robust response is seen in wells in which CAP is applied with 100 μm LY (red arrows in H). Cell viability is tested in F and I with addition of 50 mm KCl. The color bar in D indicates magnitude of the Ca2+ response ranging from lowest (purple) to highest (white) response. BL, Baseline.