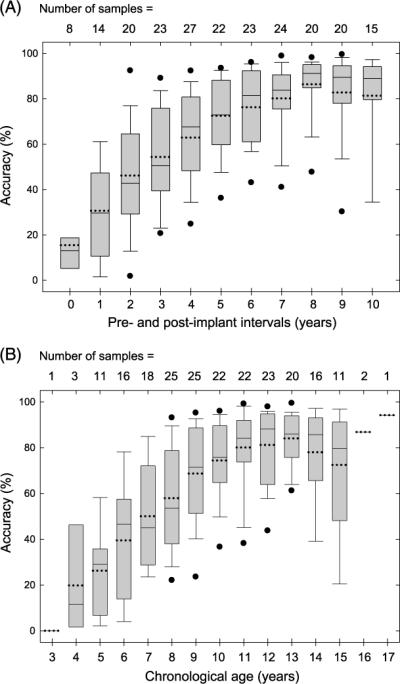
Figure 1.

(A): Distributions of the group of pediatric cochlear implant (CI) recipients' speech sound production from 0 year (preimplant) to 10 years (postimplantation). (B): Distributions of the group of pediatric CI recipients' speech sound production as a function of their chronological age. The x-axis displays the preimplant and post-implant annual sessions. The y-axis displays the accuracy in speech sound production (percentage correct). The mean and median are displayed by the dotted and solid lines across each box, respectively. The upper and lower bounds of each box represent the first and third quartiles, the end of the whiskers are located ± 1.25 SD away from the mean, and the filled circles represent the 5th and 95th percentile bounds (if they fall outside of the end of the whisker). The total number of speech samples available from each session is shown on the top of each bar.
