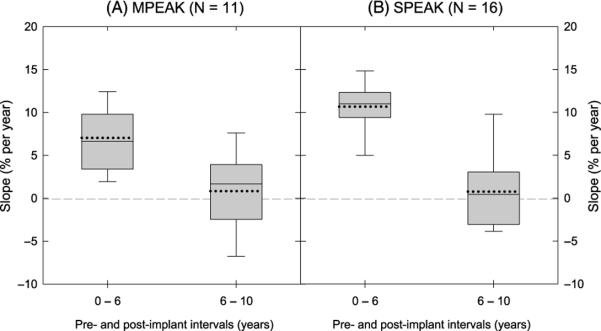
Figure 3.
Distributions of the slopes estimating the pediatric CI recipients' improvement rates of speech sound production from 0–6 to 6–10 years postimplantation. Panels A and B display the slopes estimating the improvement rate for the participants in the MPEAK and SPEAK subgroups, respectively. The x-axis displays the preimplant and postimplant annual sessions. The y-axis displays the slopes; that is, the improvement rate of accuracy in speech sound production (percentage correct). See caption to Figure 1 for details of symbols in the plot. MPEAK = multipeak; SPEAK = spectral peak.

