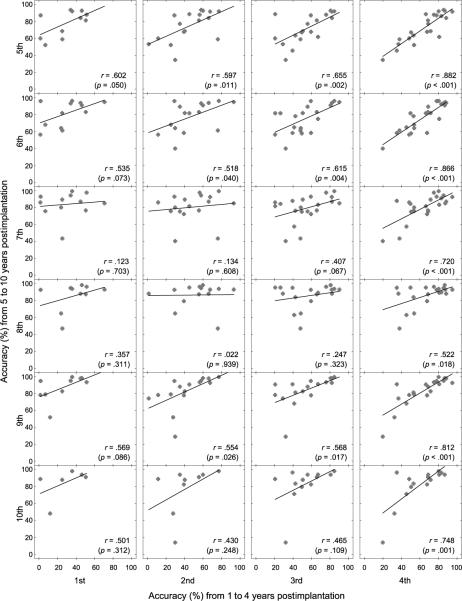
Figure 5.
Distributions of the group of CI participants' accuracy in speech sound production with each of 5–10 years of device experience, as a function of the accuracy with each of 1–4 years of device experience. Pearson correlation coefficients (r values) and p values are indicated in the panels. The line on each panel displays display the best fitted linear regression line.

