
Figure 2.
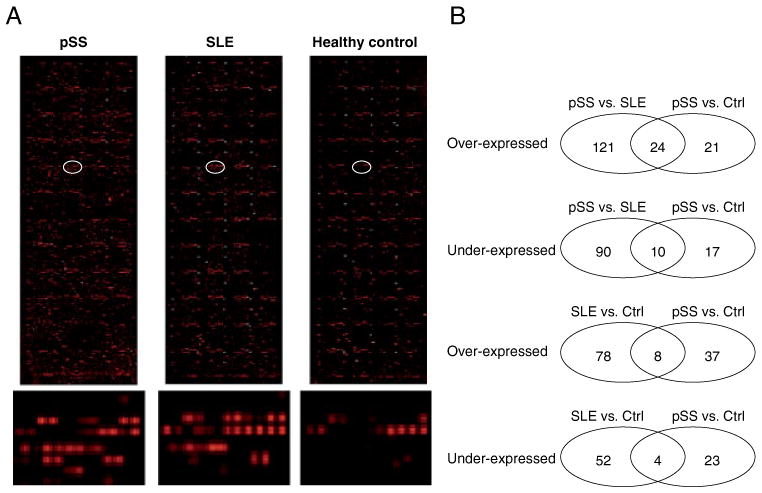
Protein microarray profiling of saliva autoantibodies in pSS, SLE, and healthy control subjects (n=13 for each group). (A) Microarray images for salivary autoantibodies in pSS, SLE, and healthy control subjects. The bottom panel shows the closeup images for the circled array spots. (B) Venn diagrams showing the number of saliva autoantibodies either over-expressed or under-expressed based on each of the two-group comparisons.