

Abstract
Study Objective
To examine the conventional wisdom that declines in AFC accelerate after about 37 years of age has influenced clinical decision making. We critically examine evidence for this sudden acceleration
Design
cross-sectional study
Setting
Academic setting
Patients
252 Caucasian women aged 25-45 with regular cycles, a community-based study
Interventions
Antral follicle counts were measured by transvaginal ultrasound in early follicular phase.
Main outcome measure
determination of the rate of AFC decline with age
Results
The relationship of AFC with age was determined by comparing a linear model with 4 non-linear models (biphasic, quadratic, spline, and power). The linear model estimates the follicle decline as 0.97 follicles/yr. The biphasic model had estimates of 0.76 follicles/yr prior to 39.6 years of age and 1.92 follicles/yr thereafter. At age 35 the linear, quadratic, broken line, spline and power models gave estimated declines (respectively) of 0.97, 0.94, 0.76, 0.17, and 0.90 follicles/yr. At age 43 the values were 0.97, 1.51, 1.92, 1.78, and 1.64 follicles/yr. The quality of model fit was comparable for all models.
Conclusion
AFC decline with age in a Caucasian population is best described as a gradual acceleration in decline with age. Therefore AFC alone should not be used to determine aggressive treatment due to fear of rapid loss of follicles.
Keywords: AFC, ovarian aging, age-related infertility
INTRODUCTION
Loss of ovarian function has a profound impact on a woman’s hormonal milieu and her subsequent risk for the development of disease. Improved understanding of reproductive aging would affect reproductive decision-making, long-term quality of life, and would have economic and social implications. In particular, we consider whether the ovarian reserve or decline in antral follicle count (AFC), accelerates among older women. This rate of loss may significantly impact pregnancy planning and infertility treatment decisions.
The number of follicles remaining within the ovaries has potential implications for predicting reproductive outcomes. In the adult woman, germ cells may encounter one of several fates: they may remain quiescent, be recruited for further development and ovulation, or apoptose (1). Although somewhat controversial, over time, without regeneration, the population of oocytes (follicles) will be depleted until less than a thousand remain and menopause ensues (2, 3). Prior to menopause, as the follicle count (ovarian reserve) diminishes with age, the quality of oocytes also declines, resulting in infertility and miscarriage rates (4). A determination of the rate of decline may allow us to project reproductive status and aging.
Using cross-sectional data, Faddy, et al. developed a mathematical model for the rate of follicle decline using data that was combined from multiple previously published autopsy studies (5-7). Their original analysis using a log-scale purported to show a sudden acceleration in the decline of oocytes at about 37 years of age (i.e. a biphasic relationship) (6). However, in a re-analysis of their data, there was little support for a biphasic relationship and it was more suggestive of a gradual decline (8, 9). Most recently, Hansen et al. analyzed the rate of non-growing follicles (NGF) within a single population and showed that rather than a sudden change in follicle loss, there is a gradual acceleration in the loss over time (10).
The AFC is considered a reliable non-invasive method for determining the ovarian reserve. The assumption that the number of antral follicles is proportional to the number of non-growing follicles that are remaining in the ovary, is supported by histologic data and has led investigators to compare the relationship between AFC, measured by transvaginal ultrasound, and age (5, 11, 12). In the study by Scheffer et al., the only other study to evaluate the rate of AFC decline in a fertile population, the data was log-transformed and supported a biphasic linear model over that of a simple linear model (13). This pattern was similar to the bi-exponential pattern seen by Faddy et al. in their modeling of ovarian specimens, and as a result validated the correlation that AFC accurately reflects the residual follicular pool (6).
We analyzed the relationship between AFC and age without performing a log transformation. Our approach leads to more readily interpretable results and stronger biological relevance. Log transformations are typically justified on three grounds: 1) to make the statistical distribution closer to normality (by reducing the degree to which too-large values are outlying), 2) to straighten out curved relationships, or 3) to deal with only positive values. Previous studies which show the ingrained biphasic model between AFC and age have analyzed the relationship on log scales. However, transformation of data that exhibit a downturn actually accentuates the curvature, rather than making the modeling more straightforward. This is supported by Leidy et al., who argued that the biphasic relationship observed by Faddy et al. was an artifact of the log transformation. Additionally, AFC on the original scale may be more likely related to biological processes than log-transformed data. For example, hormonal markers of ovarian aging are more likely to be proportional to the actual number of follicles remaining in the ovaries, as opposed to the log of the number of follicles remaining.
In the present study, we also sought to characterize the relationship of antral follicle count on the original scale with chronological age in a fertile population. Notably, most studies on AFC have focused on infertile populations or women seeking fertility treatments. Our cohort is also larger and racially-homogeneous (Caucasian), making it more appropriate for isolating the relationship of AFC with age, than previous studies (13, 14). Via careful statistical modeling we examine the level of support for a biphasic relationship. Understanding the relationship between follicle number and age has important implications for pregnancy planning and counseling.
MATERIALS AND METHODS
Patient population
This study population includes 252 Caucasian women aged 25-45, enrolled in a community-based cohort consisting of women not seeking treatment for fertility or other medical problems. This population is derived from the Ovarian Aging (OVA) study (NIH RO1-HD044876), which is designed to be a multi-ethnic cohort. Subjects were recruited from a sampling frame that consisted of all age-eligible female members of the Kaiser Permanente Northern California Health Plan in geographical areas within reasonable distance to the research clinic. Institutional Review Board approval was obtained both from Kaiser Permanente and the University of California San Francisco. Inclusion in the study required subjects to have intact ovaries, with no prior ovarian surgery or history of gonadotoxic therapy, regular menses at 22-35-day intervals, and to have not used estrogen or progestin-containing medications for 3 months prior to enrollment.
Antral follicle count assessment
All subjects underwent transvaginal ultrasound assessment of antral follicle count and ovarian volumes, performed on the 2nd-4th day of the menstrual cycle. Utilizing a Shimadzu SDU-450XL machine, with a variable 4-8 mHz vaginal transducer, measurements of the transverse, longitudinal, and anteroposterior diameters of each ovary were made using electronic calipers. All echo-free structures in the ovaries were regarded as follicles. Follicles with a mean diameter (of two dimensions) between 2 and 9 mm were counted. The volume of each ovary was calculated by applying the formula for an ellipsoid: L × H × W × π/6. All examinations were performed by one of two examiners (MIC, MPR). Our internal data has shown excellent correlations between repeated measurements (R2 = 0.92).
Statistical analysis
Total AFC for each subject was determined by summing total AFC for both ovaries. Total AFC was plotted versus chronological age for a graphical representation of the relationship. Each of five models were subsequently fit to quantify the relationship of AFC on age using nonlinear least squares and SAS Proc NLIN (SAS Version 9.12, Cary, NC). The five models fit were: 1) Linear Model, which included only a single variable, age: AFC = B0 + B1*(Age); 2) Quadratic Model, in which age and age2 were both independent variables: AFC = B0 + B1*(Age) + B2*(Age2); 3) Broken Line Model, which specified two different slopes (biphasic) that would explain the relationship of age and AFC before and after a denoted break, R (which is estimated from the data). The model was specified as AFC = B0-B1*(R-Age) for R < Age and AFC = B0 + B2*(Age-R) for R>Age; 4) Cubic Spline Model with specified knots at Ages 30, 35 and 40 and included age and age2 as independent variables: AFC = B0 + B1*(Age) + B2*(Age2) + B3*(Age - 30)+2 + B4*(Age - 35)+2 + B5*(Age - 40)+2 and (.)+ indicates a term which is zero if negative; 5) Nonlinear “power” model described in previous literature (10): AFC = A + B*(Age)C. Rates of decline for specific ages were calculated by differentiating the model equations.
The goodness of fit of the different models was determined by calculating the R2, root mean square error (RMSE – a measure of the variation about the regression line), AIC (Akaike Information Criterion) and BIC (Bayesian Information Criterion) Statistics. The larger the R2 and the smaller the RMSE, BIC and AIC values, the better the given model describes the relationship between age and AFC. A sensitivity analysis was performed to decide whether outliers were affecting the results of the analysis.
RESULTS
Subject characteristics are given in Table 1. The mean age was 35.4, and the range was 25-45 years of age and was evenly distributed. Seventy percent of subjects had a cycle length of between 28-32 days and the range was 22-35 days. Notably, the number of subjects that reported ever smoking was 56.4%, and the percentage that had ever given birth was 35.9%. The AFC was not different between the two ovaries of the entire study population (P = 0.58).
Table 1.
Baseline characteristics of participants of the study (n = 252)
| Variable | Mean ± (SD) | Minimum | Maximum |
|---|---|---|---|
| Age @ TVUS | 35.38 ± (4.97) | 25 | 45 |
| AFC | 15.7 ± (9.4) | 1 | 58 |
| Height (cm) | 166.4 ± (6.1) | 148.2 | 182.4 |
| Weight (kg) | 67.7 ± (16.4) | 48.7 | 146.6 |
| BMI | 24.5 ± (5.6) | 17.4 | 58.4 |
| Waist Hip Ratio | 0.75 ± (0.05) | 0.42 | 0.96 |
| Smoker (ever/current/past) | 56.4% | 13.6% | 30.0% |
| Parity (none/one/>one) | 64.1% | 15.4% | 20.5% |
The 5 models fitted to the data are graphically presented in Figure 1. The Linear Model estimates the follicle decline as 0.97 follicles/yr and is constant over all ages. The optimal threshold for the Broken Line Model was estimated to be 39.6 yrs (95% CI 35.8 to 43.5 yrs). The yearly decline was estimated to be 0.76 follicles/yr prior to 39.6 years of age and 1.92 follicles/yr thereafter. By definition, the decline in the nonlinear models varies by age. For comparison, we give the rates of decline at age 35 and 43. At age 35 the Linear, Quadratic, Broken Line, Spline and Power models gave estimated declines of 0.97, 0.95, 0.76, 0.17, and 0.90 follicles/yr, respectively. At age 43 the values were 0.97, 1.52, 1.92, 1.78, and 1.62 follicles/yr. Therefore, at 1.92 follicles/yr, the Broken Line model predicts the most extreme rate of decline after approximately age 40. The rate of AFC decline was also analyzed after log transformation and showed similar findings (results not shown).
Figure 1.
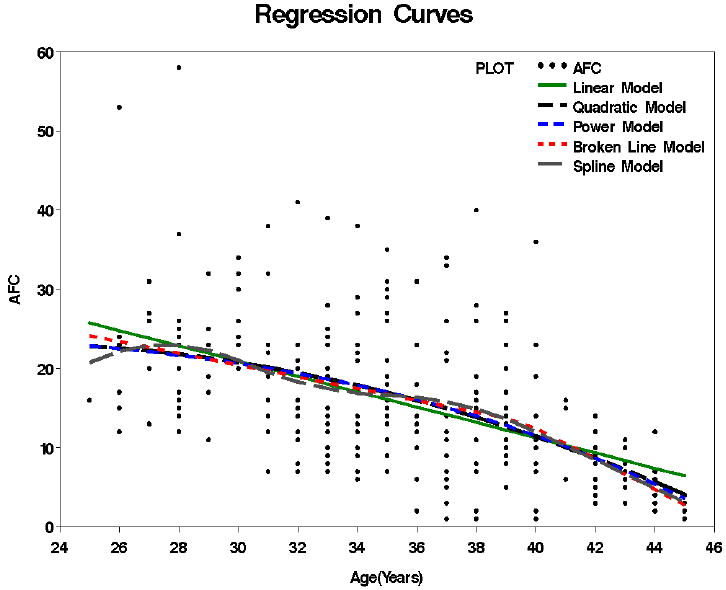
Relationships between AFC (untransformed) and chronological age. The 5 models tested: linear, quadratic, broken line, spline and power are colored coded and shown over the raw data.
The R2, RMSE, k, AIC, and BIC for each of the models tested are presented in Table 2. All the models had very similar values for each of the four measures of model fit. The Power Model had a slightly better model fit according to AIC criteria (lowest AIC value of 1052.4), and the linear model had a slightly better model fit according to the BIC criteria (lowest BIC value of 1061.1). The RMSE was similar for all models, which indicates a similar amount of unexplained variation about the regression line for each model. Tests for departure of linearity were borderline, but not statistically significant for any of the nonlinear models.
Table 2.
Parameters for assessment of model fit for each model tested
| n = 252 | R2 | RMSE | K | AIC | BIC | Linearity* (P-value) |
|---|---|---|---|---|---|---|
| Linear | 26.27 | 8.06 | 2 | 1054.1 | 1061.1 | Ref. |
| Quadratic | 27.25 | 8.03 | 3 | 1052.7 | 1063.3 | 0.068 |
| Broken line | 27.83 | 8.01 | 4 | 1052.7 | 1066.8 | 0.071 |
| Spline | 28.13 | 8.03 | 6 | 1055.7 | 1076.8 | 0.178 |
| Power | 27.34 | 8.02 | 3 | 1052.4 | 1062.9 | 0.176 |
P < 0.05 indicates evidence for nonlinearity.
DISCUSSION
Historically, the decline in oocytes with aging was thought to have a sudden accelerated rate after the age of 37 or at a specific ovarian reserve threshold (6, 8, 12, 15). Recently, Hansen et al. challenged the theoretical relationship between nongrowing follicles and age, and found that there is not a sudden change in oocyte number, but rather a subtle change in decay with increasing age (10). In this study, we have compared how AFC declines with age in a Caucasian population with regular menstrual cycles and determined that, similar to Hansen et al., the trajectory of AFC with age is best described as a gradual acceleration in decline with age.
Several studies have shown that investigators and practitioners can be misled by the way data are displayed (16-18). The use of log-transformed data accentuates the biphasic nature of follicle decline. The perception that there is a sudden intensification in AFC decline at a certain age has influenced clinical decision making in fertility management of older women in recent years. The widespread support of the abrupt change in the rate of AFC decline was precipitated by a study that only compared the biphasic model to the linear model (13). Interestingly, a study which evaluated AFC longitudinally in an older population (> 39 years of age) found no significant change in over 4 years of time (19). In our study, we analyzed the data on an original non-transformed scale to eliminate the potential artifacts and allow for more interpretable results.
Faddy et al. developed a mathematical model showing a bi-exponential decline in oocyte number with an acceleration when this number equals approximately 25,000 (6). In their model, this occurred on average, at 37.5 years of age. This well-accepted biphasic model is supported by the fundamental acceptance that there is a drop in fecundability in the late 30s (20). However, this support of similar contours of decline would have to assume the loss in fertility was largely due to loss of oocytes, and that the drop in fecundability was considered non-stochastic. In fact, other very thorough investigations suggest that there is steady decline in fecundability from the 20s until the end of the reproductive life span, without evident acceleration with increasing age (21).
If the driving force is the remaining number of oocytes and women reach this threshold at varying ages, then the “average” relationship estimated from cross-sectional data will follow a smooth acceleration in decline, not a biphasic relationship. This concept was eluded to by Faddy et al. who showed that a gradual decline may be a better fit of the data and suggested that it is more biologically realistic to have a gradual decline rather than an abrupt change (8). Indeed, the most recent study that evaluated the relationship between NGF and age confirmed that a gradual acceleration of loss was a better fit than an abrupt decline(10).
In our analysis we compared multiple nonlinear models of AFC decline with age. We found a “power” model, which was used to analyze NGF decline with age, was among the best fit of the models tested. All of the nonlinear models showed, at best, a very modest and gradual acceleration of follicle loss with age. In fact, none of the nonlinear models were significantly different from the Linear Model, though the P values for nonlinearity were suggestive for the Quadratic and Broken Line Models. By the age of 43, the most extreme nonlinear models (the Broken Line Model) only predict a total AFC count of approximately 2 lower than the Linear Model. These findings suggest that practitioners should not change fertility management for the fear that there is a dramatic drop-off in follicle number after the age of 37. Rather, these data indicate that follicle number declines with age in a fairly linear fashion and that there is great variability in AFC between women. Moreover, these findings underscore the importance of assessing, counseling, and treating women on an individual basis.
A major limitation of this study is that it is cross-sectional data and is limited to Caucasians. However, this dataset has the advantage of being relatively homogenous, decreasing any potential ethnic-specific variation that may exist. Currently we are enrolling subjects of different ethnicities to address the relationship of AFC verses age in multiple different ethnic groups. Longitudinal prospective studies are needed to best characterize the relationship between AFC and chronological age. This is critical, as improving our understanding of reproductive aging has profound economic and social implications, given the complex choices women face regarding the timing of childbearing and the growing burden of infertility.
In summary, we have shown that the AFC decline with age in a Caucasian population is best described as a gradual acceleration in decline with age. Given no abrupt decline in AFC with increasing age, AFC alone should not prompt a change in management strategy.
Acknowledgments
The authors wish to express their sincere appreciation to Carolyne Addauan-Andersen, M.S. for data analysis and preparation of the graphs and tables.
Financial Support: This project was supported by NIH/NICHD and NIH/NIA Grant Number R01 HD044876 and by NIH/NCRR UCSF-CTSI Grant Number UL1 RR024131. Its contents are solely the responsibility of the authors and do not necessarily represent the official views of the NIH
Footnotes
Publisher's Disclaimer: This is a PDF file of an unedited manuscript that has been accepted for publication. As a service to our customers we are providing this early version of the manuscript. The manuscript will undergo copyediting, typesetting, and review of the resulting proof before it is published in its final citable form. Please note that during the production process errors may be discovered which could affect the content, and all legal disclaimers that apply to the journal pertain.
References
- 1.Gougeon A. Dynamics of follicular growth in the human: a model from preliminary results. Hum Reprod. 1986;1:81–7. doi: 10.1093/oxfordjournals.humrep.a136365. [DOI] [PubMed] [Google Scholar]
- 2.Johnson J, Canning J, Kaneko T, Pru JK, Tilly JL. Germline stem cells and follicular renewal in the postnatal mammalian ovary. Nature. 2004;428:145–50. doi: 10.1038/nature02316. [DOI] [PubMed] [Google Scholar]
- 3.Tilly JL, Niikura Y, Rueda BR. The current status of evidence for and against postnatal oogenesis in mammals: a case of ovarian optimism versus pessimism? Biol Reprod. 2009;80:2–12. doi: 10.1095/biolreprod.108.069088. [DOI] [PMC free article] [PubMed] [Google Scholar]
- 4.de Bruin JP, Gosden RG, Finch CE, Leaman BM. Ovarian aging in two species of long-lived rockfish, Sebastes aleutianus and S. alutus. Biol Reprod. 2004;71:1036–42. doi: 10.1095/biolreprod.103.019919. [DOI] [PubMed] [Google Scholar]
- 5.Richardson SJ, Senikas V, Nelson JF. Follicular depletion during the menopausal transition: evidence for accelerated loss and ultimate exhaustion. J Clin Endocrinol Metab. 1987;65:1231–7. doi: 10.1210/jcem-65-6-1231. [DOI] [PubMed] [Google Scholar]
- 6.Faddy MJ, Gosden RG, Gougeon A, Richardson SJ, Nelson JF. Accelerated disappearance of ovarian follicles in mid-life: implications for forecasting menopause. Hum Reprod. 1992;7:1342–6. doi: 10.1093/oxfordjournals.humrep.a137570. [DOI] [PubMed] [Google Scholar]
- 7.Block E. Quantitative morphological investigations of the follicular system in women; variations at different ages. Acta Anat (Basel) 1952;14:108–23. doi: 10.1159/000140595. [DOI] [PubMed] [Google Scholar]
- 8.Faddy MJ, Gosden RG. A model conforming the decline in follicle numbers to the age of menopause in women. Hum Reprod. 1996;11:1484–6. doi: 10.1093/oxfordjournals.humrep.a019422. [DOI] [PubMed] [Google Scholar]
- 9.Leidy LE, Godfrey LR, Sutherland MR. Is follicular atresia biphasic? Fertil Steril. 1998;70:851–9. doi: 10.1016/s0015-0282(98)00316-1. [DOI] [PubMed] [Google Scholar]
- 10.Hansen KR, Knowlton NS, Thyer AC, Charleston JS, Soules MR, Klein NA. A new model of reproductive aging: the decline in ovarian non-growing follicle number from birth to menopause. Hum Reprod. 2008;23:699–708. doi: 10.1093/humrep/dem408. [DOI] [PubMed] [Google Scholar]
- 11.Morris JL, et al. Antral follicle count by transvaginal ultrasound is reflective of the actual primordial follicle pool. Fertil Steril. 2002;78:3. [Google Scholar]
- 12.Gougeon A, Ecochard R, Thalabard JC. Age-related changes of the population of human ovarian follicles: increase in the disappearance rate of non-growing and early-growing follicles in aging women. Biol Reprod. 1994;50:653–63. doi: 10.1095/biolreprod50.3.653. [DOI] [PubMed] [Google Scholar]
- 13.Scheffer GJ, Broekmans FJ, Dorland M, Habbema JD, Looman CW, te Velde ER. Antral follicle counts by transvaginal ultrasonography are related to age in women with proven natural fertility. Fertil Steril. 1999;72:845–51. doi: 10.1016/s0015-0282(99)00396-9. [DOI] [PubMed] [Google Scholar]
- 14.Ruess ML, Kline J, Santos R, Levin B, Timor-Tritsch I. Age and the ovarian follicle pool assessed with transvaginal ultrasonography. Am J Obstet Gynecol. 1996;174:624–7. doi: 10.1016/s0002-9378(96)70439-8. [DOI] [PubMed] [Google Scholar]
- 15.Faddy MJ, Gosden RG. A mathematical model of follicle dynamics in the human ovary. Hum Reprod. 1995;10:770–5. doi: 10.1093/oxfordjournals.humrep.a136036. [DOI] [PubMed] [Google Scholar]
- 16.Cleveland WS, Diaconis P, McGill R. Variables on Scatterplots Look More Highly Correlated When the Scales Are Increased. Science. 1982;216:1138–41. doi: 10.1126/science.216.4550.1138. [DOI] [PubMed] [Google Scholar]
- 17.Doherty ME, Anderson RB. Variation in scatterplot displays. Behav Res Methods. 2009;41:55–60. doi: 10.3758/BRM.41.1.55. [DOI] [PubMed] [Google Scholar]
- 18.Doherty ME, Anderson RB, Angott AM, Klopfer DS. The perception of scatterplots. Percept Psychophys. 2007;69:1261–72. doi: 10.3758/bf03193961. [DOI] [PubMed] [Google Scholar]
- 19.van Rooij IA, Tonkelaar I, Broekmans FJ, Looman CW, Scheffer GJ, de Jong FH, et al. Anti-mullerian hormone is a promising predictor for the occurrence of the menopausal transition. Menopause. 2004;11:601–6. doi: 10.1097/01.gme.0000123642.76105.6e. [DOI] [PubMed] [Google Scholar]
- 20.Menken J, Trussell J, Larsen U. Age and infertility. Science. 1986;233:1389–94. doi: 10.1126/science.3755843. [DOI] [PubMed] [Google Scholar]
- 21.O’Connor KA, Holman DJ, Wood JW. Declining fecundity and ovarian ageing in natural fertility populations. Maturitas. 1998;30:127–36. doi: 10.1016/s0378-5122(98)00068-1. [DOI] [PubMed] [Google Scholar]