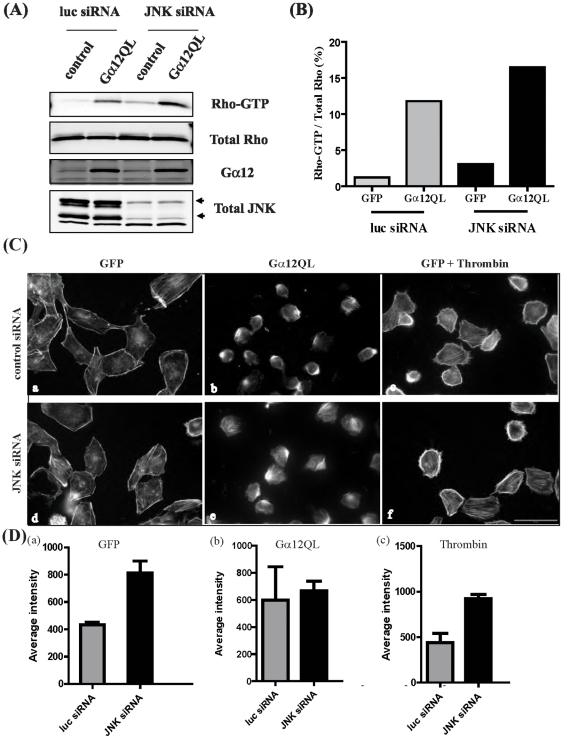
Figure 4. ROCK and JNK signal downstream of Gα12QL-activated Rho.
(A) MDA-MB-231 cells were transfected with control (luc) siRNA or JNK siRNA for 3 days prior to infection with GFP (control) or Gα12QL adenovirus for 6–7 h. Cells were starved for ∼18 h and lysed. Lysates were subjected to pull-down assays using a GST fusion construct of the activated RhoA-binding domain of rhotekin, and levels of precipitated Rho-GTP were determined by immunoblot analysis using anti-RhoA antibody. Total levels of RhoA, Gα12 and JNK in the lysates are also shown. (B) The data in the anti-Rho immunoblots shown in (A) was quantified by plotting the intensities as percentage of activated Rho to total Rho for each sample. (C) MDA-MB-231 cells were plated on coverslips and transfected with siRNA as stated above, prior to infection with GFP (control) (panels a, d) or Gα12QL (panels b, e) adenovirus. Cells were starved for ∼18 h, and those in two conditions (panels c, f) treated with 1 U/ml thrombin for 10 min as indicated before all cells were fixed and stained with rhodamine-phalloidin to visualize actin (see Materials and Methods ). Representative images for each condition are shown. Bar, 50 µM. Each panel shows the results of a single experiment that is representative of three independent experiments. (D) Fluorescence intensities of rhodamine-phalloidin staining were quantified using MetaMorph 7.5 software. Average fluorescence intensities are plotted as mean ± SE for data from two slides imaged with the same exposure time for every condition shown; ∼220 cells (panels a, c), and ∼120 cells (panel b) quantified per slide.

