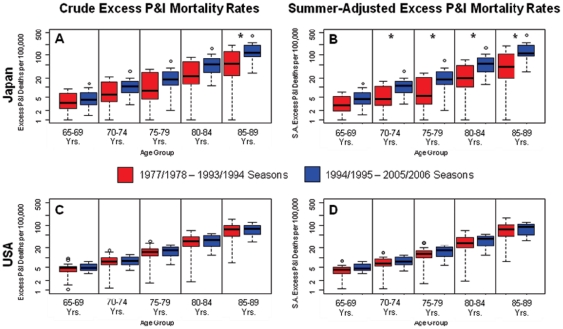
Figure 3. Crude (left panels) and adjusted (right panels) excess pneumonia & influenza (P&I) seasonal mortality rates by age group and time period in Japan (top) and the US (bottom).
Rates were adjusted for time trends in the baseline risk of mortality. Asterisks indicate statistically significant differences between the two time periods using Wilcoxon's Rank Sum Test (P<0.05).

