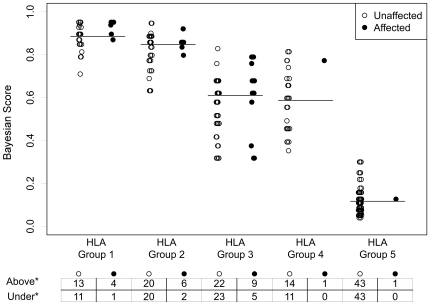
Figure 2. Distribution of CD sibs based on their BS.
Affected (n = 29) and unaffected (n = 220) CD sibs were classified on the basis of their BS value < or ≥ median BS within each HLA group. Horizontal lines correspond to the median BS of all sibs in each HLA risk-group (HLA Group 1 = 0.90, HLA Group 2 = 0.86, HLA Group 3 = 0.62, HLA Group 4 = 0.60, HLA Group 5 = 0.13).

