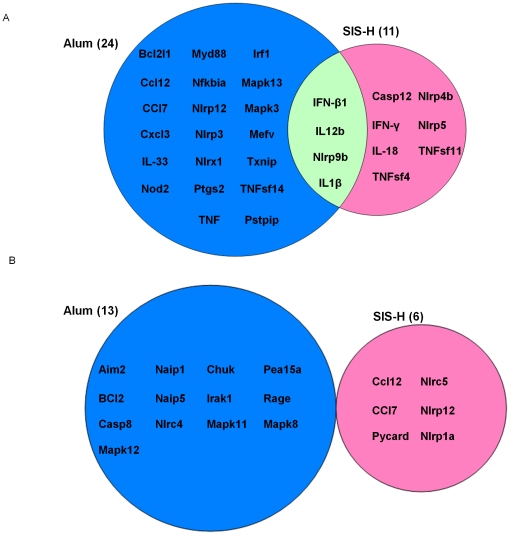
Figure 2. RT-PCR Microarray analysis of transcriptome profiles of inflammatory genes induced by vaccine adjuvants alone in mouse peritoneum.
Eighty-four genes were assessed and those genes up-regulated (A), or down regulated (B) with an average log2 ratio ≥1.5 were selected and plotted as a Venn diagram. Results for the alum-treated group refer to our previous study [24].

