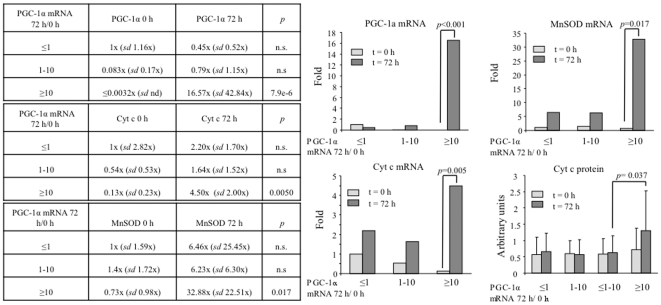
Figure 2. PGC-1α induction after STEMI correlates with Cyt c and MnSOD induction.
A) PGC-1α mRNA levels, B) MnSOD mRNA levels, C) Cyt c mRNA levels, D) Cyt c protein levels, in the blood mononuclear fraction of 37 STEMI patients right after hospital admission (t = 0) and 72 h later (t = 72 h). Samples were grouped according to the induction rate of PGC-1α mRNA leves after STEMI (PGC-1α mRNA 72 h/PGC-1α mRNA 0 h) in three groups, those that did not induce PGC-1α (≤1), those that induced PGC-1α up to 10-fold (1–10) and those that induced PGC-1α more that 10-fold (≥10). Data are means +/−SD. n.s = non statistically significant. Significance: p<0.05.

