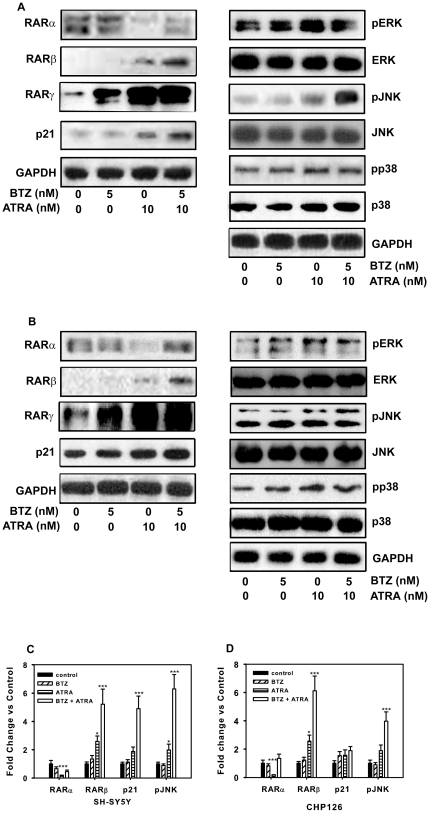
Figure 3. Protein expression levels in ATRA and bortezomib-induced differentiation.
SH-SY5Y (A) and CHP126 (B) cells were incubated with 5 nM bortezomib, 10 nM ATRA and bortezomib plus ATRA, as well as under control conditions for 72 h. Western blotting (WB) was used to detect the expression of RARα, RARβ, RARγ, p21, JNK, pJNK, ERK, pERK, p38 and pp38. Densitometric analysis of the autoradiographic plaques of significantly changed proteins in SH-SY5Y (C) and CHP126 (D) cells. Statistical analysis was performed by t-test where appropriate. *P<0.05, **P<0.01,***P<0.001, significant difference from control cells. BTZ = bortezomib.

