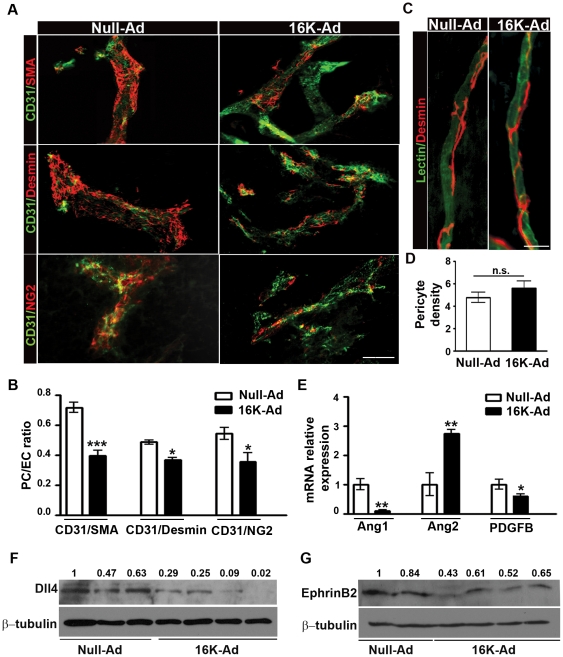
Figure 2. Reduced pericyte coverage in B16F10 tumor vessels after 16K-Ad treatment.
(A) Representative photographs of 80 µm thick tumor sections from 16K-Ad- and Null-Ad-inoculated mice, double-stained for the endothelial cell marker CD31 (green) and the mural cell markers α-SMA, desmin, and NG2 (red). (B) Computer-assisted image analysis was used to quantify pericyte coverage. The area occupied by vessels and the covered area were estimated. Coverage was calculated by dividing the latter area by the former. The data represent, for each set of conditions, the mean ratio ± SEM calculated for all the fields of all tumor sections (one section per tumor). We analyzed 10 tumors of Null-Ad-treated and 8 tumors of 16K-Ad-treated mice. Bar, 100 µm. (C) Representative photographs of tracheal capillaries. Tracheal capillaries from 16K-Ad- and Null-Ad-inoculated mice were visualized by lectin-FITC staining (green) and pericytes were visualized by desmin immunostaining (red). Bar, 25 µm. (D) Computer-assisted image analysis was used to quantify pericyte density. (E) RNAs were extracted from tumors and the relative abundance ± SEM of each specified mRNA (encoding pdgf-b, Ang1, or Ang2) was assessed by qRT-PCR in 10 Null-Ad tumors and 8 16K-Ad tumors. (F) Western blot analysis of Dll4 and (G) EphrinB2 in different 16K-Ad-treated and control tumors. n.s., non significant. *, P<0.05. **, P<0.001. ***, P<0.0001.

