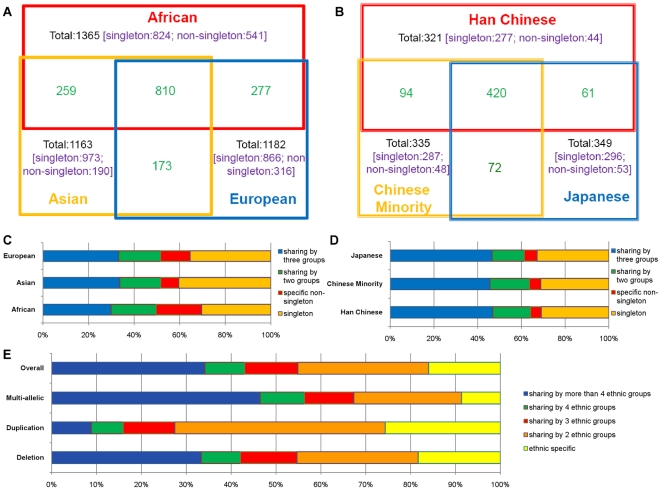
Figure 4. CNV sharing.
Venn diagram (A) and bar chart (C) of CNV sharing results among African, Asian and European groups (each group with sample-size 425). Venn diagram (B) and bar chart (D) of CNV sharing results among Han Chinese, Chinese minority and Japanese groups (each group with sample-size 75). (E). Bar chart of sharing results in 708 non-singleton CNVRs (333 deletion CNVRs, 113 duplication CNVRs and 254 multi-allelic CNVRs) among 7 Chinese ethnic groups.

