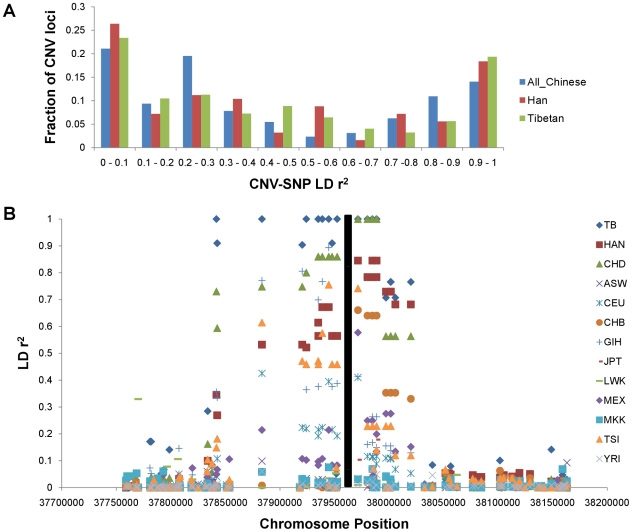
Figure 8. Linkage disequilibrium between CNPs and SNPs.
(A). SNPs taggability of all 155 Chinese, 80 Han and 41 Tibetan for common CNV regions (frequency>10%). SNPs located within 20 kb of either ends of CNV regions were included and SNP with maximum r2 among each CNVR was counted. (B). A deletion chr3:37,957,109–37,969,705 where LDs are almost perfect in Tibetan and CHD but weak in other populations. Black bar represents the location of this CNV.

