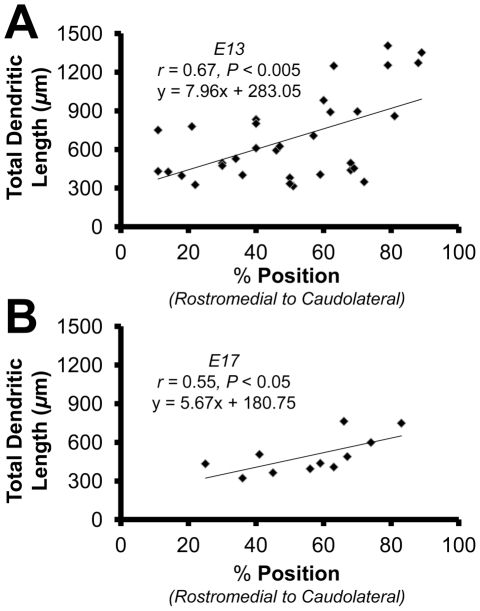
Figure 1. Total dendritic length is correlated with a neurons position along the tonotopic axis.
A: Scatter plot, least-squares regression, and correlation coefficient for neurons sampled along the tonotopic axis at E13 (n = 33). B: Scatter plot, least-squares regression, and correlation coefficient for neurons sampled along the tonotopic axis at E17 (n = 11).

