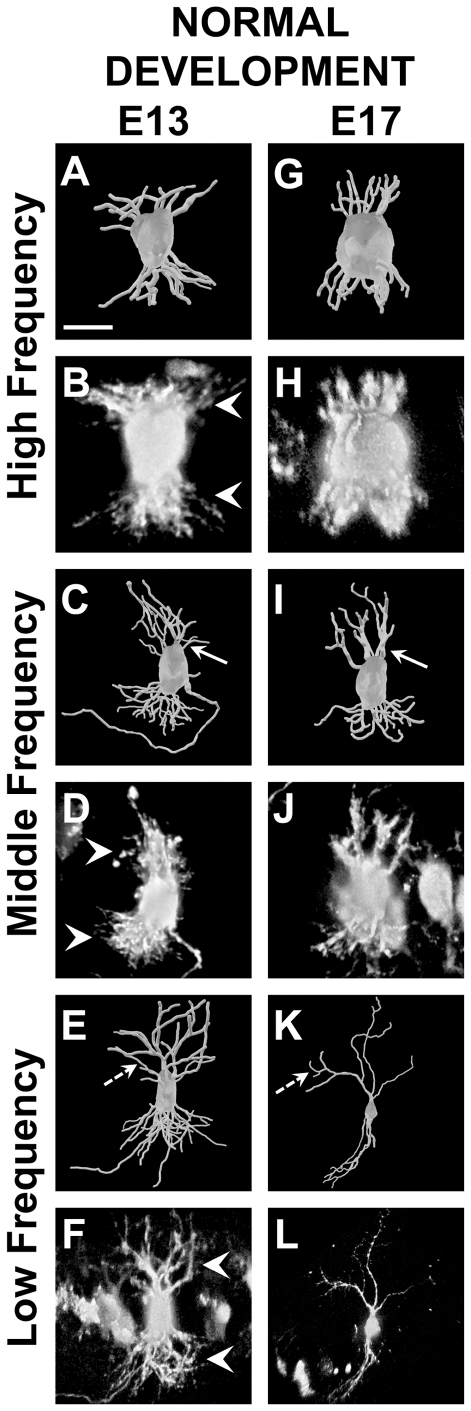
Figure 2. 3D reconstructions and raw images of neurons from NL at E13 and E17.
A and B: High frequency neuron at E13 with total dendritic length of 398 µm. In B note the dense plexus of dendritic arbors (white arrowheads) in contrast to the well-defined dendritic branches in other regions of NL (white arrowheads in D and F). C and D: Middle frequency neuron at E13 with a total dendritic length of 702 µm. E and F: Low frequency neuron at E13 with a total dendritic length of 1254 µm. G and H: High frequency neuron at E17 with a total dendritic length of 245 µm. I and J: Middle frequency neuron at E17 with a total dendritic length of 578 µm. Note the decrease in the number of primary dendrites from E13 to E17 (compare white arrows in C to I), particularly on the dorsal side. K and L: Low frequency neuron at E17 with a total dendritic length of 1154 µm. While there appears to be an equal distribution of high order branches at E13 (dashed arrow in E), the high order branches at E17 are located near the terminals (dashed arrow in K), resulting in longer primary dendrites. Scale bar = 15 µm A–D and G–J; 30 µm E and F; 50 µm K and L. Dorsal is up in all panels.

