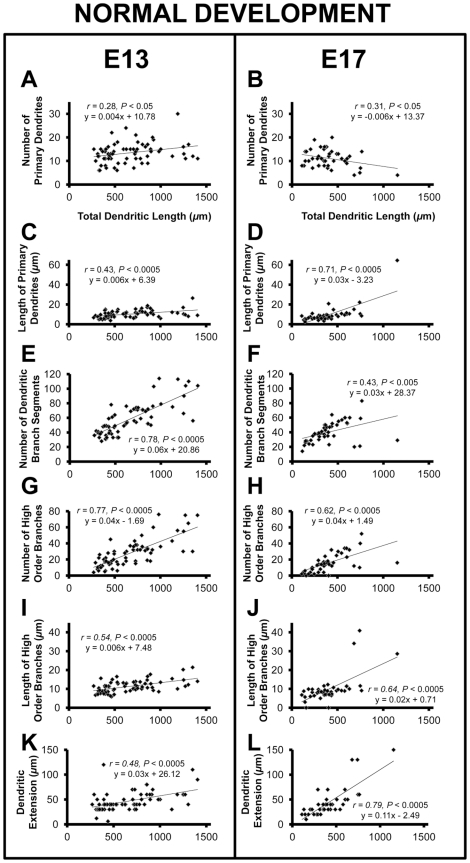
Figure 3. Properties of NL neurons along the tonotopic axis at E13 and E17.
Neurons sampled from E13 (n = 66) and E17 (n = 43) brainstems. Scatter plot, least-squares regression, and correlation coefficient for the following features which demonstrate the correlation between: A and B the number of primary dendrites to total dendritic length and a significant decrease (P<0.0005) in the slope from E13 to E17; C and D the length of primary dendrites to total dendritic length and a significant increase (P<0.005) from E13 to E17; E and F the number of dendritic branch segments to total dendritic length, as well as a significant decrease (P<0.05) in the slope from E13 to E17; G and H the number of high order branches to total dendritic length; I and J the length of high order branches to total dendritic length and a significant increase (P<0.0005) in the slope from E13 to E17; K and L dendritic extension and total dendritic length and the significant increase in the slope (P<0.0005) from E13 to E17. Together the changes from E13 to E17 result in the formation of the gradient of dendritic arbor size in NL.

