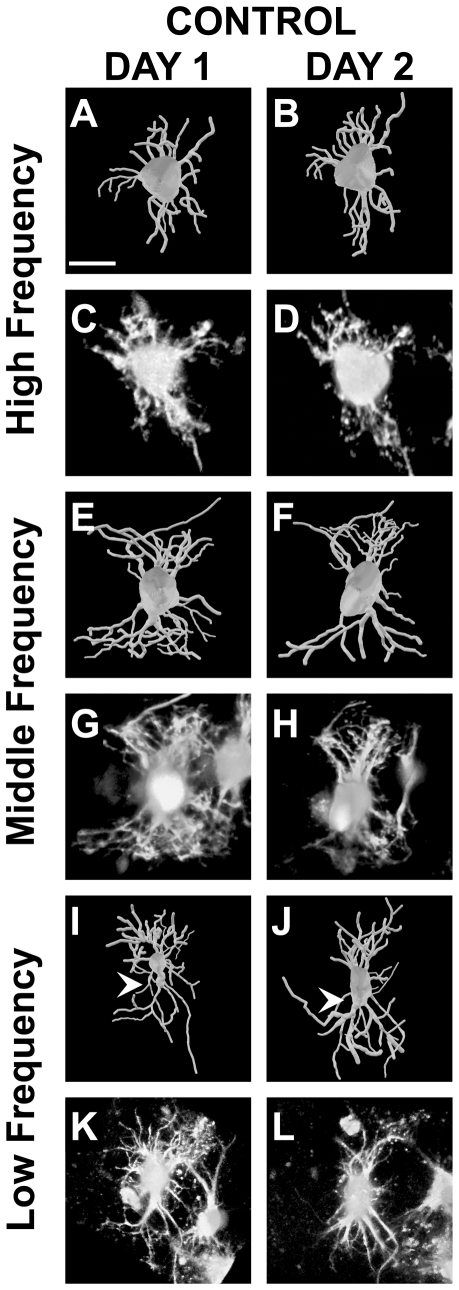
Figure 4. 3D reconstructions and raw images of NL neurons before and after treatment with control medium.
A–D: High frequency neuron with an initial total dendritic length of 434 µm. Though there is some reorganization the overall appearance from Day 1 to 2 is unchanged. E–H: Middle frequency neuron with an initial total dendritic length of 901 µm. The overall net change results in a small total dendritic length, but very little change in branch order distribution. I–L: Low frequency with an initial total dendritic length of 1132 µm. There is an increase in the number primary dendrites (white arrowheads) from Day 1 to Day 2, changes opposite from what is necessary for the primary dendrite gradient at E17. Scale bars = 15 µm A–H; 30 µm I–L. Dorsal is up in all panels.

