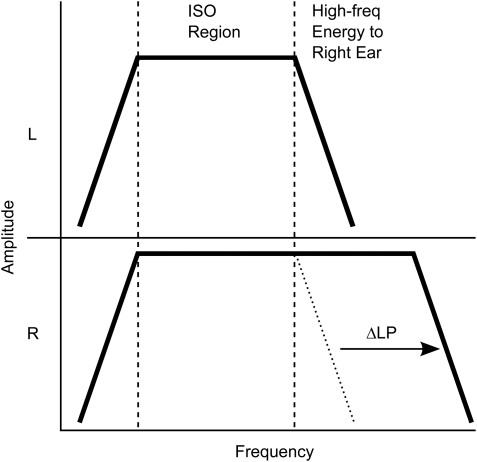
Figure 1.
Schematic depicting the relationship of the noise spectra at the left (top row) and right (bottom row) ears used. The two vertical dashed lines encompass the ISO region, which is the spectral region that is present at both ears. The arrow represents the change to the stimuli that occurred due to the manipulation of interest, and the dotted plot represents the starting point of the manipulation. The low-pass cutoff frequency of the band of noise delivered to the right ear was initially the same as that for the left ear, and was systematically increased in frequency.

