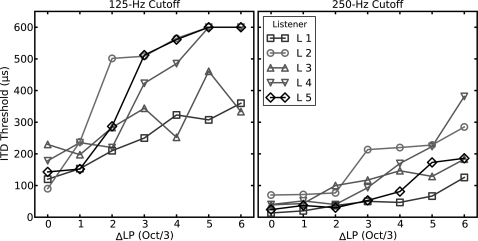
Figure 2.
(Color online) ITD thresholds, in μs, for the five listeners as a function of the difference in low-pass cutoff frequency (ΔLP) between the two ears, which is expressed in 1∕3 octaves. The left panel depicts data when the base low-pass cutoff frequency was 125 Hz, the right panel shows 250-Hz data (see Table Table 1.).

