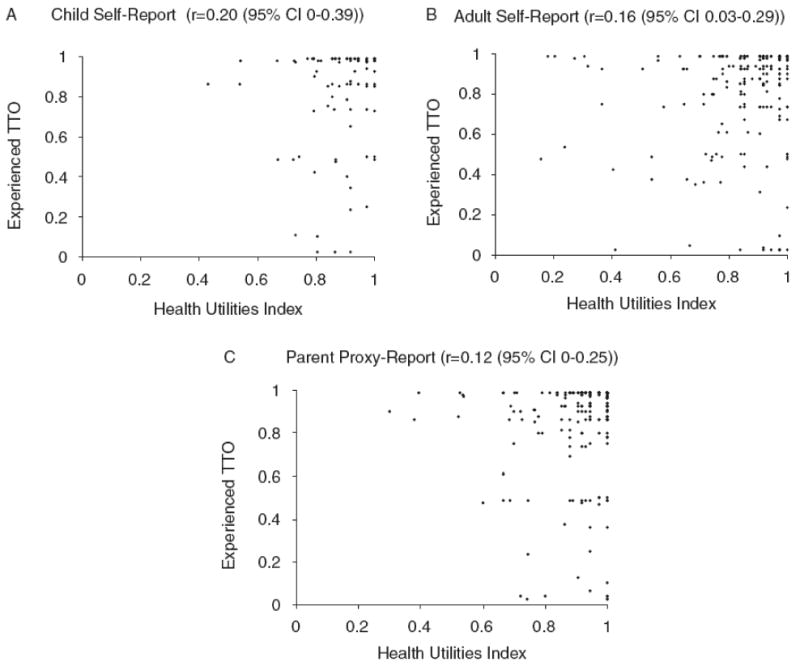
Figures 3a, 3b, 3c.

Scatterplots of health utilities using the Health Utilities Index 3 vs. Experienced Time-Trade-off (for overall quality of life) for child self-report (15-18 years) (n=95), adult self-report (n=213), and parent proxy-report (n=221)
