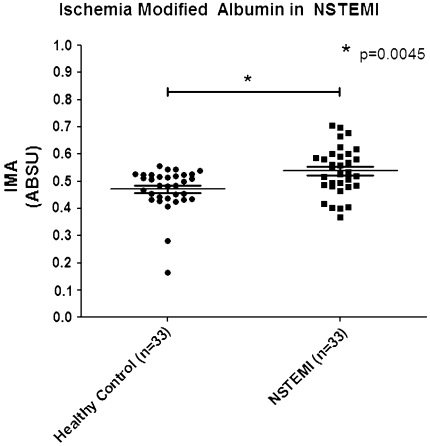
Fig. 1.
Level of serum ischemia modified albumin in NSTEMI compared with healthy control. Inside the scatter plot represent the mean and standard deviation. Comparison of serum IMA level is performed using Mann–Whitney test. The mean of serum IMA level in NSTEMI was 0.5377 ± 0.09 ABSU, which is significantly higher than that of healthy controls (P = 0.0045)

