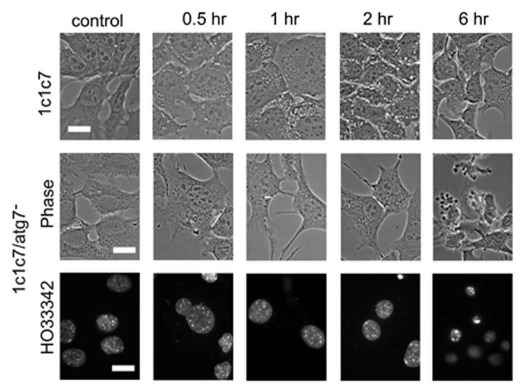
Figure 3.
Morphology of 1c1c7 WT and KD photosensitized with 0.5 µM BPD and then irradiated (90 mJ/cm2). Top row: WT controls vs. cells 0.5, 1, 2 or 6 h after irradiation. Center row: results of a similar study with the Atg7 KD line. Bottom row: HO33342-labeling of the KD cells incubated with this probe for the final 5 min of each incubation interval. White bars in figures = 20 µm.

