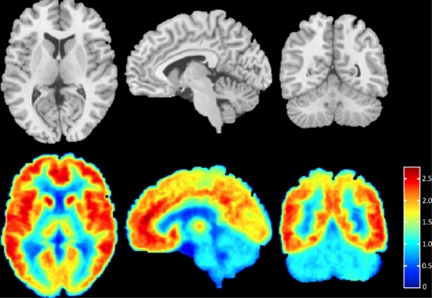
Figure 1.
Axial, sagittal, and coronal views of [11C]ABP688 binding. For each positron emission tomography image acquired (n=16), the volume of distribution (VT) was calculated at every voxel using the Logan graphical approach (Logan et al, 1990). The top row shows axial, sagittal, and coronal views of the magnetic resonance image template for anatomical reference. The bottom row shows the corresponding axial, sagittal, and coronal views of the mean [11C]ABP688 VT image (over all subjects), in the space of the high-resolution template (see text for details). The VT value associated with each color is indicated by the color bar.

