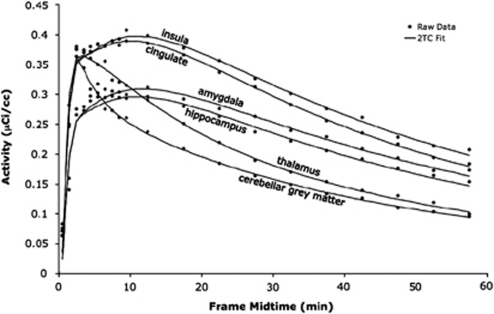
Figure 2.
Time–activity curve fits in one subject. The raw data (black circles, mean of the activity within the region) are shown for two regions with high binding (insula and cingulate), two with moderate binding (amygdala and hippocampus), and two with low binding (thalamus and cerebellar gray matter). These raw data were fit with an unconstrained, iterative two-tissue compartment model (2TC, black lines).

