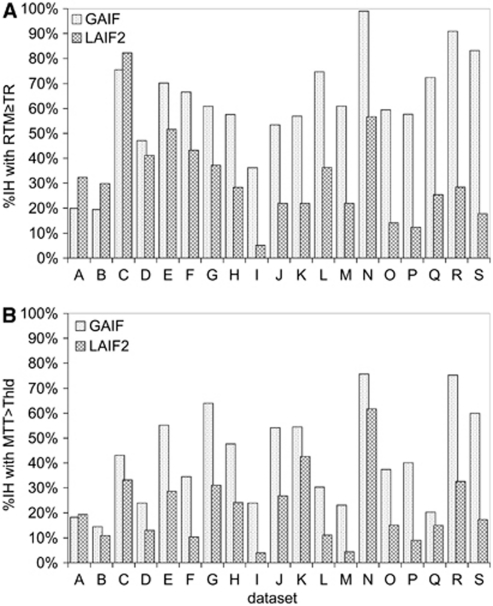
Figure 3.
Graph showing the %IH with abnormality using GAIF (dotted bars) and LAIF2 (hashed bars). The top graph (A) shows the dispersion (RTM≥TR) and the bottom graph (B) shows the hypoperfusion (MTT>Thld) for each data set A–S. GAIF, global Arterial Input Function; LAIF2, local Arterial Input Function (new method); RTM, time to rise-to-maximum value of the owMLEM residue function; MTT, mean transit time; Thld=MTTcontraGM+1.78 seconds (see text); TR, repetition time.

