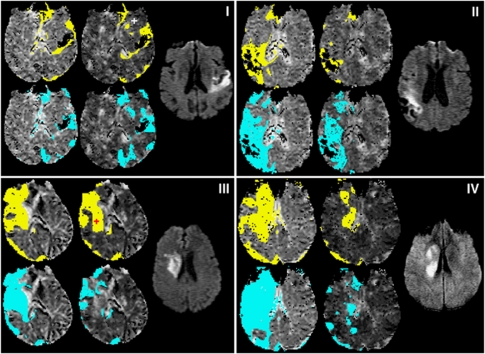
Figure 4.
Abnormal perfusion and dispersion areas from example slices in data sets A (i), F (ii), K (iii), and S (iv). In each subfigure (i–iv), the diffusion weighted image slice most closely corresponding to the perfusion slice is shown to the right. The remaining four maps are MTT, with areas of MTT>Thld overlaid in yellow (top) and RTM≥TR overlaid in blue (bottom); the left-most maps are the GAIF analysis and the central maps are the LAIF2 analysis. The crosses marking the LAIF2 perfusion maps of (i) and (iii) are the locations from which the LAIF2 time-courses in Figure 5 are taken. GAIF, global Arterial Input Function; LAIF2, local Arterial Input Function (new method); RTM, time to rise-to-maximum value of the owMLEM residue function; MTT, mean transit time; Thld=MTTcontraGM+1.78 seconds (see text).

