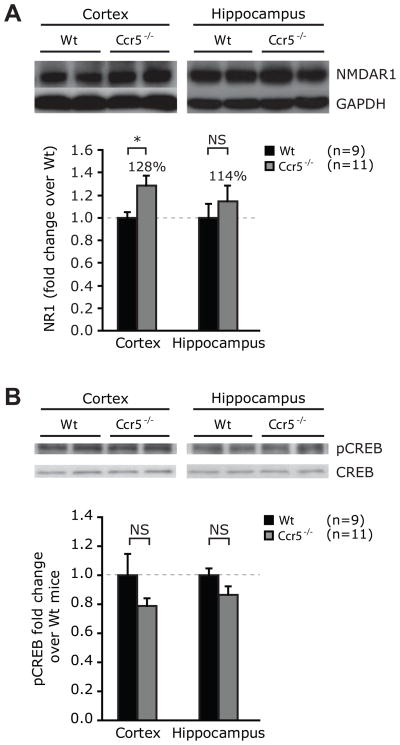
Figure 5.
Expression levels of NMDAR1 and pCREB in the cerebral cortices and hippocampi of Ccr5−/− and Wt mice. (A) NMDAR1 and (B) pCREB expression in the cortices and the hippocampi of 6–8 week old male Wt and Ccr5−/− mice was determined by Western blotting. GAPDH expression was used to control for the amount of protein loaded in panels A and B, whereas CREB expression was used in panel B. Beneath each panel, the densitometric analysis of the radiograms is shown as fold difference in expression compared to Wt animals. Data are represented as mean ± SEM. * P < 0.05 for differences between Wt and Ccr5−/− mice. NS- statistically non-significant.

