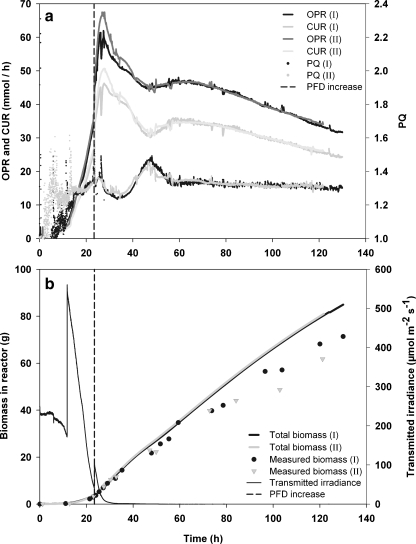
Fig. 4.
Detailed overview of duplicate batch experiments I and II at a mixing rate of 70 rpm. a Oxygen production rates (OPR), carbon dioxide uptake rates (CUR) (in mmol h−1) and photosynthetic quotient (PQ) for both experiments. All data are normalized for the time point of light increase to 1,500 μmol photons m−2 s−1, which is indicated with a dotted line. b Total biomass present in the reactor (in g) as calculated from the CUR as well as the measured dry weight present in the reactor (in g) for duplicate batch experiments I and II. Also plotted is the transmitted irradiance through the culture during the batch experiment. The two peaks indicate the stepwise light increase, the first time to 600 μmol photons m−2 s−1 when the biomass is still relatively low and the second time to 1,500 μmol photons m−2 s−1. This second light increase is indicated with a dotted line

