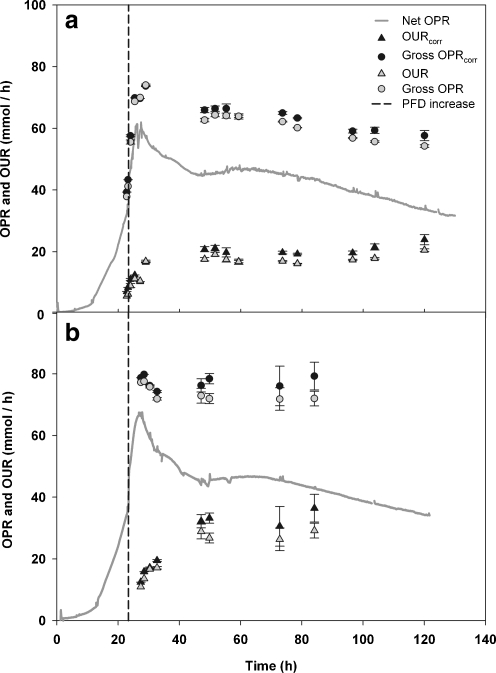
Fig. 6.
Oxygen uptake rates and gross oxygen production rates (OPR) for duplicate batch experiments I (a) and II (b) at 70 rpm. The net oxygen production rate (net OPR) was measured online during the batch cultivations. The OUR was measured with the oxygen microsensors at different time points as indicated with triangles. The error bars represent the standard deviation of duplicate or triplicate OUR measurements at that time point. Adding up the OUR and the net OPR at these time points gives the gross OPR, indicated with circles. The closed symbols give the corrected values for OUR (OURcorr), assuming no biofilm build-up in the dark tube and only in the photobioreactor. The open symbols give the values for OUR for the assumption that there was a biofilm in the dark tube, and the build-up was equal to that in the whole bioreactor. The light increase to 1,500 μmol photons m−2 s−1 is indicated by a dotted line

