
Figure 2. Expression domains of transcription factors that participate in digestive tissue identity and boundary formation.
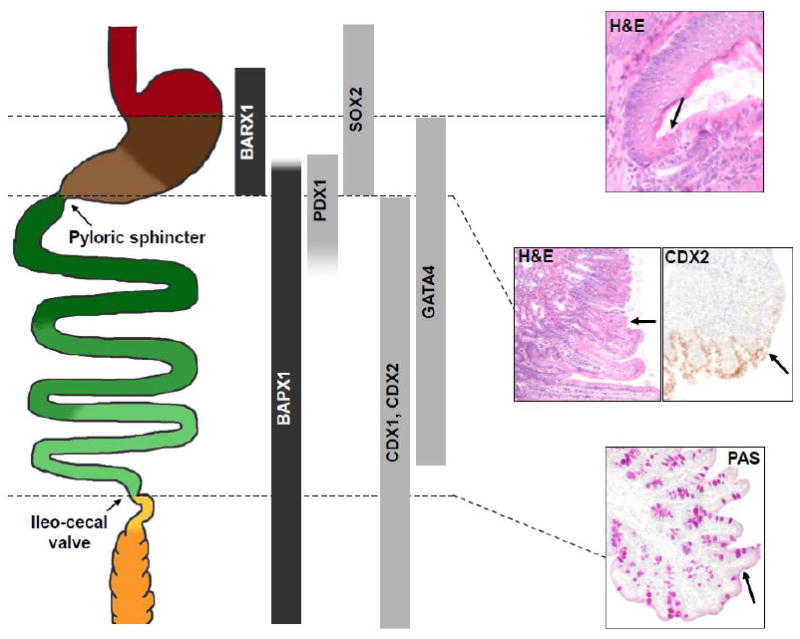
Left: Schematic diagram of the alimentary canal, stretched in the rostro-caudal axis, with discrete regions represented in the same colors as in Figure 1. Center: Expression domains of factors with known functions in epithelial specification or boundary formation. Factors expressed in the mesenchyme and epithelium are represented in black and gray, respectively. The many Hox-cluster genes expressed in the gut are not represented; see [39, 42, 48] for Hox gene expression. Right: Histologic demonstration of sharp anatomic boundaries at the mouse foregut squamo-columnar junction (top, H&E stain (adult)), gastroduodenal boundary (middle, H&E stain (adult), CDX2 immunohistochemistry (E16)), and ileo-cecal valve (bottom, Periodic acid Schiff stain (adult)). Arrows point to the respective junctions. At the foregut squamo-columnar junction, note the eosinophilic keratin lining the squamous epithelium, above the arrow, and its absence over glandular epithelium below the arrow.